Try it on your own data
Every report in this article is in the free plan. One snippet for web and apps, up to 10 sites.
Start freeA PPC dashboard is one page showing whether pay-per-click spend earns more than it costs: spend, clicks, conversions, cost per conversion and return on ad spend, broken down by campaign. The rule that makes it useful is to compare each campaign with its break-even ROAS (1 divided by gross margin), because a blended ROAS can look healthy while two thirds of the spend loses money. Below: formulas, a worked example and a layout.
What you will learn
- Show every campaign against its break-even ROAS (1 / gross margin); a blended ROAS of 2.83 hid non-brand campaigns at 1.82 in the sample
- Use the ad platform's own definitions for CPC, conversion rate and ROAS, and pick one primary conversion so the numbers mean one thing
- Expect platform clicks and analytics sessions to differ (90% in the sample); choose one for the dashboard and label it
What questions should a PPC dashboard answer?
A PPC dashboard is one screen that shows whether paid search and other pay-per-click spend is producing conversions at an acceptable cost. It should answer three questions, in this order, and every metric on it should serve one of them:
- Are we spending as planned? Spend against budget, pace for the month.
- Is the spend producing results at a cost we can afford? Conversions, cost per conversion, return on ad spend.
- Where should we change something? Which campaign, keyword group or ad is above or below the target.
A dashboard that cannot lead to a decision (click through rate in the corner, a rainbow of line charts) is a report. For the written, periodic version see PPC reports; for how to interpret the numbers once you have them, see PPC analysis. This page is about the layout and the formulas behind it.
Which PPC metrics belong on the dashboard, and how are they calculated?
Use the platform's own definitions so your dashboard matches what the ad account reports. These are the ones Google Ads documents.
| Metric | Formula | Google Ads' own example or note |
|---|---|---|
| Click-through rate | Clicks ÷ impressions | Measures whether the ad earns the click |
| Average CPC | Total cost of clicks ÷ number of clicks | Two clicks costing $0.20 and $0.40 give $0.60 ÷ 2 = $0.30 (definition) |
| Conversion rate | Conversions ÷ interactions | 50 conversions from 1,000 interactions is 5%; it can exceed 100% when more than one conversion is counted per interaction (definition) |
| Cost per conversion (CPA) | Cost ÷ conversions | Cost per customer action |
| Conversion value per cost (ROAS) | Conversion value ÷ cost | Google's formula is "Conv. value / cost" (definition) |
| Impression share | Impressions ÷ total eligible impressions | Shows whether more budget or bid could reach more people (definition) |
Two cautions before you build anything:
- Know which conversions are counted. If the account counts "every" conversion or tracks more than one conversion action, conversion rate can exceed 100% and cost per conversion changes meaning. Pick one primary conversion for the dashboard.
- ROAS is revenue, not profit. A 3.0 ROAS can lose money on a thin margin. The next two sections show how to turn it into a go or stop rule.
| Metric | Formula | Sample: brand search |
|---|---|---|
| CPC | Spend / clicks | $1,800 / 3,000 = $0.60 |
| Conversion rate | Conversions / clicks | 300 / 3,000 = 10.00% |
| CPA | Spend / conversions | $1,800 / 300 = $6.00 |
| ROAS | Revenue / spend | $14,400 / $1,800 = 8.00 |
| Break-even ROAS | 1 / gross margin | 1 / 0.40 = 2.5 |
Sample data, 40% gross margin. Definitions follow Google Ads Help.
Worked example: four campaigns, one blended number that hides losers
Sample data: one month, a store with a 40% gross margin. Revenue is the conversion value from tracked purchases.
| Campaign | Spend | Clicks | Conversions | Revenue | CPC | Conversion rate | CPA | ROAS | Profit after ad cost |
|---|---|---|---|---|---|---|---|---|---|
| Brand search | $1,800 | 3,000 | 300 | $14,400 | $0.60 | 10.00% | $6.00 | 8.00 | $3,960 |
| Generic search | $5,200 | 4,000 | 160 | $11,200 | $1.30 | 4.00% | $32.50 | 2.15 | −$720 |
| Competitor terms | $2,400 | 1,600 | 28 | $1,960 | $1.50 | 1.75% | $85.71 | 0.82 | −$1,616 |
| Display remarketing | $1,600 | 3,200 | 40 | $3,600 | $0.50 | 1.25% | $40.00 | 2.25 | −$160 |
| All four | $11,000 | 11,800 | 528 | $31,160 | $0.93 | 4.47% | $20.83 | 2.83 | $1,464 |
How each cell is computed: CPC = spend ÷ clicks; conversion rate = conversions ÷ clicks; CPA = spend ÷ conversions; ROAS = revenue ÷ spend; profit = revenue × 40% − spend. For brand search: 1,800 ÷ 3,000 = $0.60, 300 ÷ 3,000 = 10.00%, 1,800 ÷ 300 = $6.00, 14,400 ÷ 1,800 = 8.00, 14,400 × 0.4 − 1,800 = $3,960.
What the blended row hides:
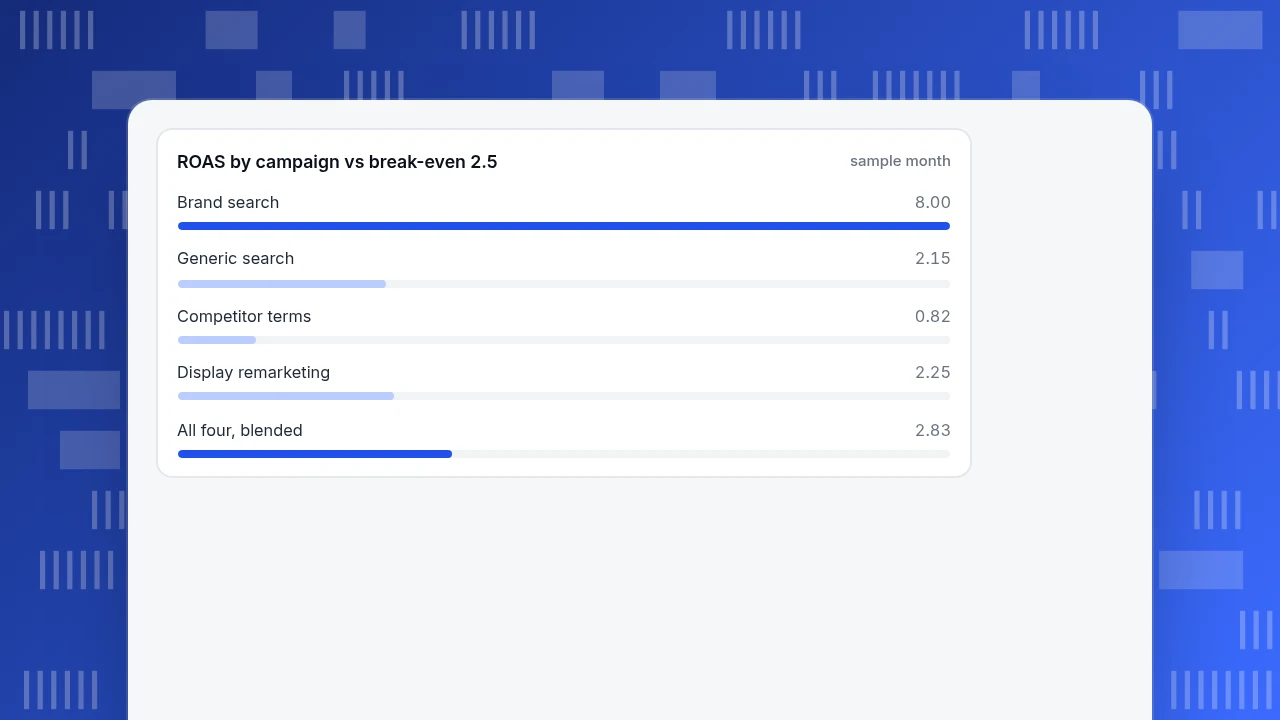
- The total ROAS of 2.83 looks healthy. It is above the break-even of 2.5 computed in the next section.
- Brand search carries everything. It earned $3,960 on 16% of the spend. Without it, the other three campaigns spent $9,200 and returned $16,760, a ROAS of 1.82, and lost $2,496 after ad cost (16,760 × 0.4 − 9,200).
- Brand clicks often capture demand that already existed. That is a judgement, not a measurement here, but it is a reason not to let an 8.00 ROAS justify spend elsewhere.
The dashboard's job is to make this visible in one table, so the blended number is never the only number on the page.
ROAS by campaign vs break-even 2.5
sample monthHow do you set a break-even ROAS and decision rules?
Break-even ROAS is the ROAS at which the ad cost equals the margin earned:
Break-even ROAS = 1 ÷ gross margin
At a 40% margin that is 1 ÷ 0.40 = 2.5; at 35% it is 2.86. Revenue of $2.50 per $1.00 of spend leaves $1.00 of margin, which exactly pays for the ad cost. Anything below that loses money before overhead.
Turn it into decision rules and write them on the dashboard, not in somebody's head. These thresholds are working rules for this example, not Google guidance:
| Condition | Action | Campaign in the sample |
|---|---|---|
| ROAS ≥ break-even and enough conversions | Keep; consider raising budget if impression share is limited by budget | Brand search (8.00, 300 conversions) |
| ROAS below break-even, 30 or more conversions | Fix before cutting: tighten keywords, lower bids, check the landing page | Generic search (2.15, 160 conversions) |
| ROAS well below break-even, fewer than 30 conversions | Cap the budget and collect one more conversion cycle before judging | Competitor terms (0.82, 28 conversions) |
| ROAS within 15% of break-even | Test the creative or the landing page before changing bids | Display remarketing (2.25, within 10% of 2.5) |
The 30-conversion floor is a practical guard, not a statistical law: with fewer conversions, one more or one fewer order moves the rate visibly.
What layout makes a PPC dashboard readable?
Order the page the way the decision is made, top to bottom.
- Row 1, six cards: spend, clicks, conversions, CPA, ROAS and profit after ad cost, each with the change against the previous period and the target next to it.
- Row 2, trend: spend and conversions by day on one chart, so a spending spike without matching conversions is obvious. Mark launches and budget changes on it.
- Row 3, campaign table: the table from the worked example, sortable, with conditional colour against the break-even ROAS. This is the row people act on.
- Row 4, diagnostics: impression share and click-through rate by campaign, and the share of spend on brand versus non-brand terms.
Rules that keep it honest:
- One primary conversion and one date range for the whole page.
- Targets shown next to every number, otherwise a number has no meaning.
- Brand and non-brand terms separated, as in the example.
- A footnote saying when conversion data was last complete: recent days undercount conversions that have not happened yet.
Why do ad platform numbers and your analytics not match?
Expect differences, and decide which source owns which number before you compare them.
| Number | Usually owned by | Why it differs |
|---|---|---|
| Spend, impressions, clicks | Ad platform | Only the platform knows what it charged |
| Sessions from the ads | Your analytics | A click is not always a loaded page: people leave before the script runs, or block it |
| Conversions and revenue | Your analytics or order system | The platform counts what its tag sees, inside its own attribution window |
Sample data: brand search had 3,000 platform clicks and 2,700 sessions in analytics, so clicks to sessions is 2,700 ÷ 3,000 = 90%. Spend per session is $1,800 ÷ 2,700 = $0.667, against a $0.60 CPC. Neither is wrong; they divide by different things. Choose one for the dashboard and label it.
How to build a PPC dashboard in TapCub
TapCub does not run, bid on or optimise ads, and it does not pull spend from an ad account on its own. It puts the spend you enter next to the sessions, conversions and revenue it measures. For the four-campaign example:
- Tag the destination links. Use
utm_source,utm_mediumandutm_campaignon each ad. In Web analytics › Sources, visits that carry click IDs such asgclidormsclkidare treated as paid search by default, and the UTM tab splits visitors and sessions by campaign. - Enter spend. In All-platform analytics › Business › Channel ROI, open Costs and add rows one by one or import a CSV with
day,channel,source,campaign,cost(and optionallyclicks,impressions). Importing the same day, channel, source and campaign again overwrites the row. - Read the ROI tab. It shows cost per click (spend ÷ sessions, so it will differ from the platform's CPC as shown above), cost per acquisition (spend ÷ purchases on the order ledger) and return on ad spend (revenue ÷ spend), grouped by channel, source or campaign. The quadrant uses sessions on the X axis, conversion rate on Y and revenue as bubble size.
- Check the goal side. For non-purchase conversions, set up a goal in Web analytics › Goals; its conversion rate divides by unique visitors, not sessions. The Sources channel table shows conversions per channel.
- Know the limits. Revenue comes from the order ledger; if spend is present and revenue stays zero, purchases have not been recorded yet. TapCub computes the three cost metrics above, not break-even or profit, so keep the margin in your own sheet.
FAQ
What is a PPC dashboard?
A PPC dashboard is a single view of pay-per-click performance: spend, clicks, conversions, cost per conversion and return on ad spend, broken down by campaign. A useful one shows targets beside each number and highlights the campaigns that fall below break-even, so it leads to a decision rather than a discussion.
What metrics should a PPC dashboard include?
Spend, clicks, click-through rate, average CPC, conversions, conversion rate, cost per conversion and ROAS, plus impression share to see whether budget limits reach. Add profit after ad cost if you know your gross margin. Keep to one primary conversion so the cost metrics mean one thing.
What is a good ROAS?
It depends on margin. Break-even ROAS is 1 divided by gross margin: 2.5 at a 40% margin. Google defines conversion value per cost as conversion value divided by cost. Compare your ROAS with your break-even, not with another business's figure.
Why is my conversion rate over 100%?
Google Ads can show a conversion rate above 100% when you count every conversion, or track more than one conversion action, because several conversions can be credited to one interaction. Use one primary conversion for the dashboard if you want the rate to stay between 0 and 100%.
How often should I check a PPC dashboard?
Check spend pace daily and campaign decisions weekly. Conversions can arrive days after a click, so a campaign's last few days look worse than they will end up. Wait for enough conversions, for example 30 or more, before cutting a campaign on conversion rate alone.
Sources
- Google Ads Help. Average cost-per-click (Avg. CPC): Definition — total cost divided by clicks, $0.20 and $0.40 example. Checked 2026-11-20.
- Google Ads Help. Conversion rate: Definition — conversions per interaction; 50 from 1,000 is 5%. Checked 2026-11-20.
- Google Ads Help. Conversion value per cost: Definition — Conv. value / cost. Checked 2026-11-20.
- Google Ads Help. Impression share: Definition — impressions divided by total eligible impressions. Checked 2026-11-20.
Was this article helpful?
We use your answers to fix and expand this page.
Couldn’t send. Please try again in a minute.
Thanks for the feedback. We’ll use it to improve this page.You’ve already sent feedback on this page. Thanks.

Customer Experience Consultant
Writes about live chat, visitor conversations, and self-service, sharing practical ways to make customer communication clearer and more effective.