Try it on your own data
Every report in this article is in the free plan. One snippet for web and apps, up to 10 sites.
Start freeWebsite performance optimization is moving the slowest quarter of your real visitors under three thresholds: LCP within 2.5 seconds, INP at 200 milliseconds or less and CLS at 0.1 or less, all at the 75th percentile. Measure with field data, split the failing metric by page and device, then fix the largest subpart first. In the example below, that order takes a 4.1 s page to 2.3 s, and the server turns out to be the smallest problem.
What you will learn
- Judge success on real-user data at P75, mobile and desktop separately, not on a single lab score
- Split LCP into TTFB, load delay, load duration and render delay, and fix by seconds saved per day of effort
- Verify each fix against the subpart it should move, and annotate the release so later readers can see why a line changed
What are you optimizing toward?
Website performance optimization means moving the slow tail of your real visitors under three published thresholds, not making a lab score look nicer. Google's Core Web Vitals set the targets: largest contentful paint (LCP) within 2.5 seconds, interaction to next paint (INP) at 200 milliseconds or less, and cumulative layout shift (CLS) at 0.1 or less. Each is judged at the 75th percentile of page loads, mobile and desktop separately. "Good at P75" means three out of four real visits meet the target.
Two supporting numbers help you diagnose. Time to first byte (TTFB) is good at 0.8 seconds or less and poor above 1.8 seconds, also at P75. TTFB is not a Core Web Vital, but it is the first slice of every LCP.
| Metric | Measures | Good at P75 | Poor at P75 |
|---|---|---|---|
| LCP | When the main content is visible | ≤ 2.5 s | > 4 s |
| INP | Delay between a tap or key press and the next frame | ≤ 200 ms | > 500 ms |
| CLS | Unexpected movement of content | ≤ 0.1 | > 0.25 |
| TTFB | Server and network time before the first byte | ≤ 0.8 s | > 1.8 s |
The bar is not low. The HTTP Archive's 2024 Web Almanac performance chapter reports that 43% of mobile sites and 54% of desktop sites passed all three vitals that year, and only 59% of mobile sites had a good LCP. If you are failing, you are in the majority, and the question is which metric to attack first.
How do you measure before you change anything?
Measure with field data first, because the thresholds are defined on it. Lab and field data differ: a lab run is one device, one network and usually a cold cache, while field data is the distribution of real visits, including caching and interactions. Google's public field dataset aggregates 28 days, so a fix shows up gradually, not the next morning.
Use this decision rule to pick the first target:
- Is any vital outside "good" at P75? If none, stop; you have a content problem, not a speed problem.
- Is more than one outside "good"? Take the one furthest over its threshold in relative terms (LCP 4.1 s against 2.5 s is 64% over; CLS 0.12 against 0.1 is 20% over).
- Split that metric by page, country and device. If one segment holds most of the slow loads, you have a localized cause (for example, one template or one region without a CDN), and the fix is smaller than a site-wide rebuild.
- Only then open a lab tool to reproduce the slow segment and see the waterfall. Lab is for finding causes, field is for scoring.
Write down the baseline before touching anything: metric, P75 value, share of loads rated good, and the date range. Without it, you cannot tell a fix from a quiet week.
Where does the LCP time go?
LCP is not one delay. Google splits it into four subparts: TTFB, resource load delay (the gap before the browser starts fetching the LCP image or font), resource load duration (the download) and element render delay (the gap between finishing the download and painting). The guideline is roughly 40% TTFB, under 10% load delay, 40% load duration and under 10% render delay.
Sample data: a mobile product page has a P75 LCP of 4.1 seconds.
| Subpart | Measured | Share of 4.1 s | Budget at 2.5 s | Over budget |
|---|---|---|---|---|
| TTFB | 1.3 s | 31.7% | 1.00 s (40%) | +0.30 s |
| Resource load delay | 0.5 s | 12.2% | 0.25 s (10%) | +0.25 s |
| Resource load duration | 1.6 s | 39.0% | 1.00 s (40%) | +0.60 s |
| Element render delay | 0.7 s | 17.1% | 0.25 s (10%) | +0.45 s |
| Total | 4.1 s | 100% | 2.50 s | +1.60 s |
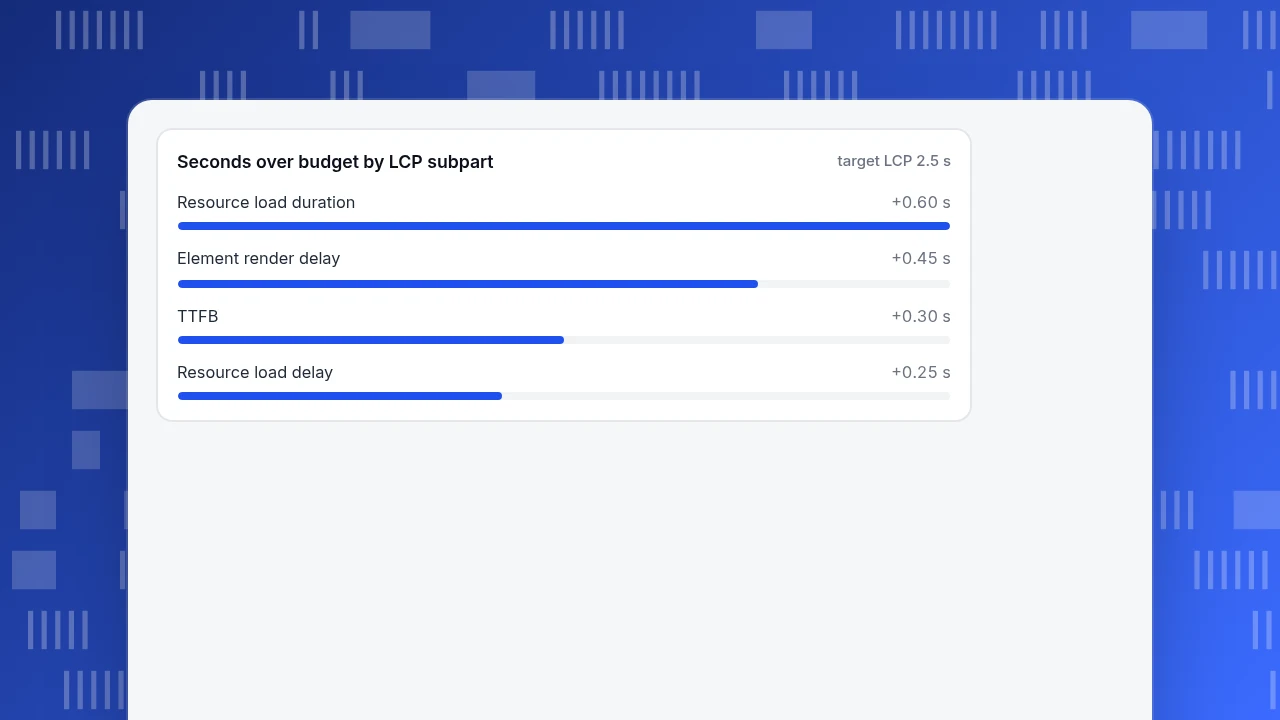
The recomputation: 1.3 + 0.5 + 1.6 + 0.7 = 4.1 s, and the overshoots 0.30 + 0.25 + 0.60 + 0.45 = 1.60 s, which equals 4.1 − 2.5. The surprise is that the server is the smallest problem here, even though many teams start with hosting. The page loses most to the image download (+0.60 s) and to the browser waiting to paint (+0.45 s). Reading the budget this way tells you what to fix before you spend a sprint on the wrong layer.
Seconds over budget by LCP subpart
target LCP 2.5 sIn what order should you fix things?
Order fixes by seconds saved per day of effort, then check the order against Google's own ranking of impact. Google's LCP guide lists the steps in this order: eliminate resource load delay, eliminate render delay, reduce load duration, reduce TTFB. The effort numbers below are a team's own estimates in the sample; replace them with yours.
Sample data, continuing the product page:
| Priority | Fix | Subpart | Assumed saving | Assumed effort | Seconds per day |
|---|---|---|---|---|---|
| 1 | Make the LCP image discoverable in the HTML, remove lazy-loading from it, add fetchpriority="high" | Load delay | 0.4 s (0.5 → 0.1) | 0.5 day | 0.80 |
| 2 | Resize the hero image, serve a modern format, cache it at a CDN | Load duration | 0.6 s (1.6 → 1.0) | 2 days | 0.30 |
| 3 | Remove render-blocking CSS and synchronous scripts from the head, break up long tasks | Render delay | 0.4 s (0.7 → 0.3) | 1.5 days | 0.27 |
| 4 | Cache HTML at the edge, remove redirect hops, tune the backend | TTFB | 0.4 s (1.3 → 0.9) | 3 days | 0.13 |
If all four land as assumed, LCP becomes 0.9 + 0.1 + 1.0 + 0.3 = 2.3 s, inside the 2.5 s target with 0.2 s to spare. If only the first two land, it is 4.1 − 0.4 − 0.6 = 3.1 s: better, still not good. That is the reason to fix in order and re-measure after each step: stop when the P75 is under target, and do not pay for fix 4 if fixes 1 to 3 are enough.
Treat "assumed saving" as a hypothesis. Each fix is a bet on a subpart; the field data after release is the result.
| Priority | Fix | Subpart moved | Assumed saving |
|---|---|---|---|
| 1 | Discoverable, non-lazy LCP image with high fetch priority | Load delay | 0.4 s |
| 2 | Right-sized modern image on a CDN | Load duration | 0.6 s |
| 3 | No render-blocking CSS or sync scripts; split long tasks | Render delay | 0.4 s |
| 4 | Edge-cached HTML, fewer redirects, faster backend | TTFB | 0.4 s |
Sample data for a 4.1 s mobile product page. Savings and effort are assumptions; re-run the order with your own estimates.
What about INP and CLS?
Check them after LCP, using the same rule: split by page and device first.
INP. INP is the slowest interaction in a visit, made of input delay (main thread busy), processing time (your handlers) and presentation delay (waiting for the next frame). The usual cause is long main-thread work. A long task is any task over 50 milliseconds, and the fix is to yield between chunks of work, using scheduler.yield() where supported (Chrome and Edge 129, Firefox 142; not Safari) with a setTimeout fallback. Remove or defer third-party scripts that run on click. Rule: if INP fails on mobile only, suspect script weight before the server, because input delay and processing time both run on the visitor's device.
CLS. The causes are few: images, ads and embeds without reserved space; content injected above existing content; web fonts swapping late; animations that change layout properties. Fixes are mechanical: set width and height (or aspect-ratio) on images, give ad slots a min-height and keep the placeholder if no ad loads, use font-display: optional or tuned fallback metrics with a preload for key fonts, and animate transform instead of top or left.
How much will faster pages earn?
Cite a measured test, not a rule of thumb. In a Vodafone case study, a 50/50 A/B test on paid traffic (about 100,000 clicks and 34,000 visits a day per version) differed only in Web Vitals work: server-side rendering of a widget, a resized hero image and not loading off-screen images. The faster version had 31% better LCP (5.7 s against 8.3 s) and 8% more sales, 15% better lead-to-visit rate and 11% better cart-to-visit rate.
That is one retailer's result, not a promise. Use it to size the experiment, not the forecast.
Sample data for a back-of-envelope check: 100,000 visits a month, 2.0% conversion, $60 average order = 2,000 orders and $120,000. A hypothetical 8% sales gain is 2,000 × 1.08 = 2,160 orders, +$9,600 a month. If the project costs 8 days of work, you can ask whether $9,600 a month is plausible for your pages, then check it with the same approach: ship the fix to part of the traffic, or compare similar weeks, and read conversion from your analytics, not from the speed tool.
How do you know a fix worked?
Check three things after release, in this order:
- The subpart moved. If you cut load delay, the load delay figure should fall; a lower LCP with the same delay means something else changed.
- P75 crossed the threshold for mobile and desktop separately, after the 28-day window has rolled far enough, or after enough days of your own field data.
- The business number did not move the wrong way. Compare conversion, bounce and error rate before and after, and annotate the release date on the chart so a later reader can see why a line changed.
Beware small samples: percentiles on a page with a few dozen loads jump around, so judge on pages with enough traffic, or group pages by template.
How to run this in TapCub
Take the product page from the example. TapCub is a measurement layer here; it does not fix the page or run lab audits, but it gives you the field baseline and the check afterward.
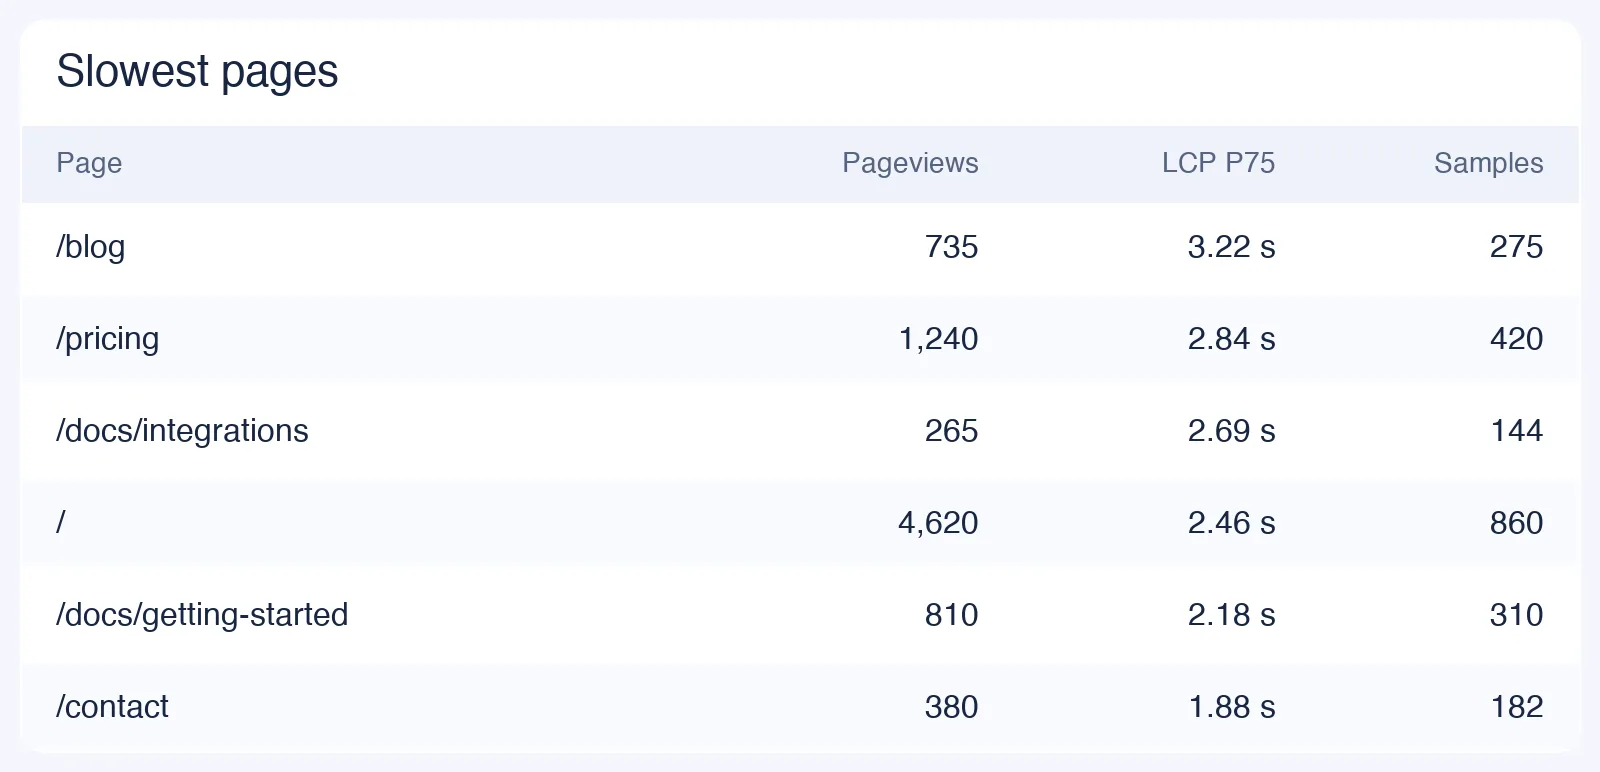
- Read the baseline. Open Monitoring › Performance. The five cards (LCP, CLS, INP, first contentful paint and TTFB) use the same thresholds as above; switch to P75 and look at the share rated good.
- Find who is slow. Break down by page, country, device, browser or operating system, and read the Slowest pages list, which is sorted by P75 LCP. The load timing view splits one load into backend (TTFB), network transfer and frontend render, a coarser cut than the four subparts above but enough to tell server problems from page problems.
- Check that those pages are losing people. Open Web analytics › Pages for the same URLs to compare bounce and engagement with the speed numbers.
- Mark the release. Add a note in Configuration › Annotations on the day you deploy. The performance page has no previous-period comparison, so the annotation is how you read before and after on the trend chart.
- Know the limits. Metrics are reported by the visitor's browser; if the script is blocked or an old snippet is installed, the page is empty. The 0 to 100 score only combines LCP, INP and CLS and is not a site audit. TapCub does not run lab tests, so use a lab tool to reproduce a slow segment.
FAQ
What is website performance optimization?
It is the work of making real visitors' page loads and interactions fast enough to meet published targets, mainly Core Web Vitals at the 75th percentile: LCP within 2.5 s, INP at 200 ms or less and CLS at 0.1 or less. The practical loop is measure with field data, find the slow segment, fix the largest subpart first, then re-measure.
What should I optimize first on a slow website?
Start with the Core Web Vital furthest over its threshold, and for LCP start with resource load delay: make the LCP image discoverable in the HTML, never lazy-load it and give it high fetch priority. In the sample, that was a half-day change worth 0.4 s, the best seconds-per-day return of the four fixes.
What is a good TTFB?
At the 75th percentile, Google rates TTFB good at 0.8 seconds or less and poor above 1.8 seconds. In the sample, 1.3 s sat in the middle band: not the largest overshoot (+0.30 s against its 1.0 s budget), which is why it was fixed last.
How long until improvements show in field data?
Google's public field dataset aggregates 28 days, so a fix reaches a stable value after about four weeks. Your own analytics can show movement within days if traffic is high enough; read it at P75 and split by device before concluding.
Should I trust PageSpeed or lab scores?
Use them to reproduce and debug a slow segment, not to judge success. Core Web Vitals assessment uses field data at P75; a lab test is a single device, network and location with a cold cache.
Sources
- Google. Web Vitals, Optimize Largest Contentful Paint, Optimize Interaction to Next Paint, Optimize CLS, Time to First Byte and Lab and field data differences — thresholds, LCP subparts and 28-day field window. Verified 2026-11-20.
- Google. Optimize long tasks — the 50 ms definition and yielding. Verified 2026-11-20.
- HTTP Archive. Web Almanac 2024: Performance — 43% mobile and 54% desktop pass rates. Verified 2026-11-20.
- Google. Vodafone: A/B test of Web Vitals — 31% LCP, 8% sales. Verified 2026-11-20.
Was this article helpful?
We use your answers to fix and expand this page.
Couldn’t send. Please try again in a minute.
Thanks for the feedback. We’ll use it to improve this page.You’ve already sent feedback on this page. Thanks.

Customer Experience Consultant
Writes about live chat, visitor conversations, and self-service, sharing practical ways to make customer communication clearer and more effective.