Try it on your own data
Every report in this article is in the free plan. One snippet for web and apps, up to 10 sites.
Start freeSaaS CRO means raising the share of visitors who sign up, activate and pay, by measuring each stage and working on the one you can actually test. A 20% relative lift at any stage lifts paid customers by 20%, so the choice depends on headroom, time to measure and cost. In the sample below, activation can be tested in about three weeks while paid conversion would need nearly seven months.
What you will learn
- Track four stages as cohorts of people: visitor, signup, activated, paid; exclude bots first
- Equal relative lifts at any stage give equal paid gains, so choose by headroom, test time and cost
- Compute the sample size per stage; if testing takes months, test an upstream change and watch paid as a lagging check
What is SaaS CRO, and what makes it different?
SaaS conversion rate optimisation (CRO) is the work of raising the share of visitors who sign up and then pay, by fixing the specific steps where people leave. It differs from ecommerce CRO in one structural way: the journey has more stages and a longer gap. A shop converts in one visit. A software product converts in four steps over days or weeks: visitor to signup, signup to activation (the person reaches the first real value), activation to paid, and then retention. Each step has its own people, its own reasons for drop-off and its own sample size.
That is why a single "conversion rate" hides most of what matters. If 0.48% of visitors become paying customers, the number alone does not tell you whether to work on the pricing page, the signup form or the first-run experience. You need the rate at every stage, and you need to know which stage you can actually test. For benchmark ranges by company type see B2B SaaS conversion rates; for how to run experiments see CRO testing. This article is about reading your own funnel and choosing where to act.
How do you measure the funnel?
Define four stages with events you can count, a counting unit and a window.
| Stage | Event that counts | Counting unit | Window |
|---|---|---|---|
| Visitor | A human session on a marketing page (bots excluded) | Person or session | Period |
| Signup | Account created | Person | Same period |
| Activated | First meaningful action (for example, first project created or first report viewed) | Person | 7 days after signup |
| Paid | First payment | Person | 30 days after signup |
Three rules prevent most arguments. Count people for stages after signup, because a person can sign up once. Use a cohort view, meaning the people who signed up in March and what they did by day 30, rather than dividing this month's paid by this month's signups, because the payers this month signed up earlier. And define "activated" as one event that predicts retention in your product, not "logged in twice".
Exclude non-human traffic before you compute anything. Crawlers and monitoring bots inflate the visitor count and make every downstream rate look worse than it is.
| Stage | Event that counts | Window |
|---|---|---|
| Visitor | Human session on a marketing page | Period |
| Signup | Account created | Same period |
| Activated | First meaningful action | 7 days after signup |
| Paid | First payment | 30 days after signup |
Count people after signup and use cohorts, not this month's paid over this month's signups.
What does a worked funnel look like?
Sample data: one month for a software site.
| Stage | People | Rate from previous stage | Rate from visitors |
|---|---|---|---|
| Visitors | 20,000 | — | 100% |
| Viewed pricing | 6,000 | 30.0% | 30.0% |
| Signed up | 800 | 13.3% of pricing viewers | 4.0% |
| Activated within 7 days | 480 | 60.0% | 2.4% |
| Paid within 30 days | 96 | 20.0% | 0.48% |
How to recompute: 6,000 ÷ 20,000 = 30.0%; 800 ÷ 20,000 = 4.0%; 480 ÷ 800 = 60.0%; 96 ÷ 480 = 20.0%; 96 ÷ 20,000 = 0.48%. (Signups ÷ pricing viewers is 13.3% only as an indication, because some people sign up without opening pricing.) Paid ÷ signups is 96 ÷ 800 = 12.0%.
Now notice a property of funnels that changes how you prioritise. The result is a product of the rates: 4.0% × 60% × 20% = 0.48%. A 20% relative improvement at any one stage lifts paid customers by the same 20%: signup 4.0% to 4.8% gives 115.2 paid (96 × 1.2), and activation 60% to 72% or paid 20% to 24% give the same. A stage is not "more important" by its position or its size. What differs is how hard the lift is to achieve and how long it takes to measure. That is the next question.
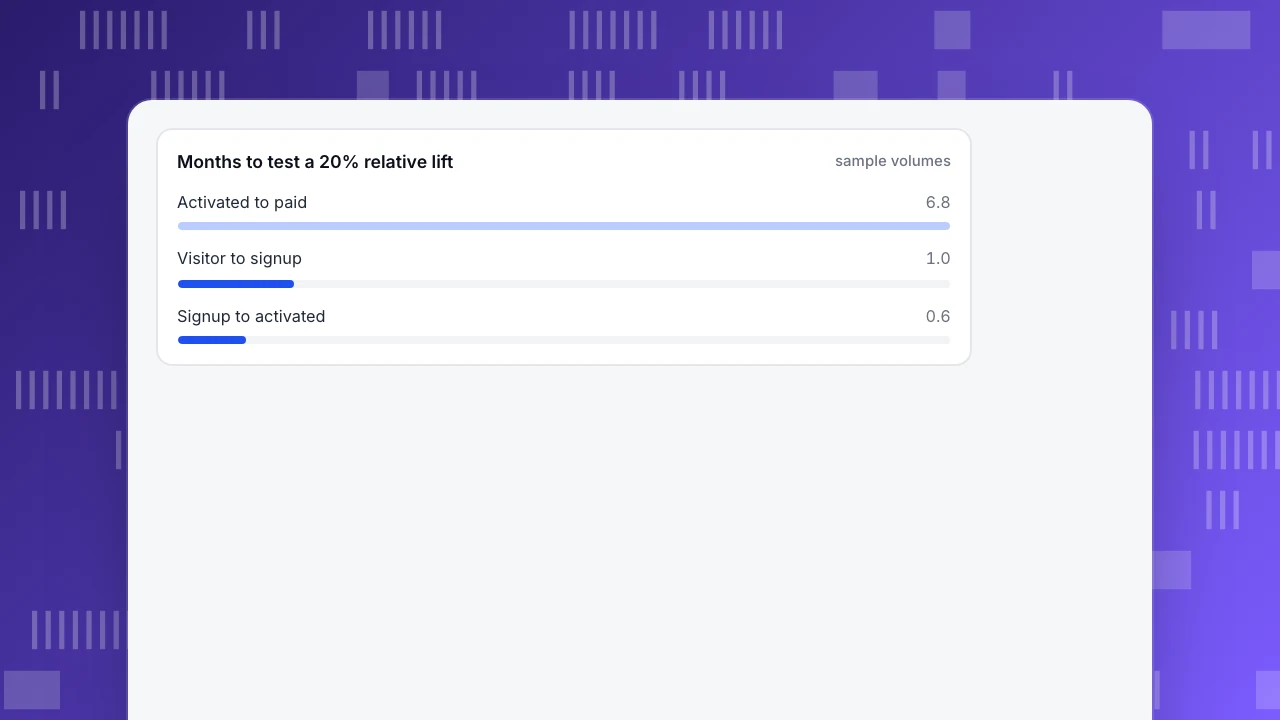
Months to test a 20% relative lift
sample volumesWhich stage should you work on first?
Rank stages on three things, not on how low the rate looks:
- Plausible lift. How much better could the rate be? A signup page with eight fields and a slow load has more headroom than one with three fields that already loads fast.
- Time to learn. A test needs enough people to detect the change you hope for. The required sample for testing a proportion against a known baseline comes from the standard formula N ≥ ((z(1−α/2)·√(p₀(1−p₀)) + z(1−β)·√(p₁(1−p₁))) ÷ δ)², where δ is the gap you want to detect (NIST/SEMATECH e-Handbook, section 7.2.4.2, checked 2026-11-21). At 5% significance and 80% power, with an A-versus-B comparison needing roughly twice that per arm, the sample is:
| Stage | Lift to detect | Sample per arm (about) | Total needed | Months at sample volume |
|---|---|---|---|---|
| Visitor to signup | 4.0% to 4.8% | 9,940 visitors | 19,880 visitors | 1.0 (20,000 visitors a month) |
| Signup to activated | 60% to 72% | 249 signups | 498 signups | 0.6 (800 signups a month) |
| Activated to paid | 20% to 24% | 1,634 activated | 3,268 activated | 6.8 (480 activated a month) |
How to recompute: the single-sample sizes are 4,970 visitors, 125 signups and 817 activated users (z = 1.96 and 0.8416 for 5% two-sided and 80% power); doubling gives the per-arm figures, doubling again gives the total. Months are total ÷ monthly volume (498 ÷ 800 = 0.6; 3,268 ÷ 480 = 6.8).
The result is practical. At this volume the activation step can be tested in about three weeks, the signup step in about a month, and the paid step would need almost seven months, so you would not test paid conversion directly. You would test an upstream change and watch the paid rate as a lagging check.
- Cost of the change. A copy edit is cheaper than rebuilding onboarding.
Pick the stage where plausible lift is large, testing is quick and the change is cheap. In this sample that is usually activation or the signup form.
What should you fix at each stage?
Concrete fixes, in the order people usually find value:
- Visitor to signup.
- Speed. Deloitte's study of 37 brand sites and over 30 million sessions found that a 0.1 second improvement in mobile site speed lifted retail conversion by 8.4% and travel conversion by 10.1% (web.dev, "Milliseconds Make Millions", data from late 2019, checked 2026-11-21). Google's research found the probability of a mobile visitor bouncing rises 32% as load time goes from 1 second to 3 seconds (Think with Google, checked 2026-11-21).
- Fewer fields. Ask for what you need to create the account; ask for the rest after.
- One clear action per page, and a call to action that names the outcome.
- Pricing page that answers the questions people open it with: what it costs, what is included and what happens at the limit.
- Signup to activated.
- Cut the steps between signup and first value. Count them; most products have more than they think.
- Remove empty states by offering a sample project or template.
- Look at where new users stop. Rage clicks and dead ends are evidence.
- Activated to paid.
- Tie the upgrade prompt to the moment of need (a limit reached, a feature tried), not to a calendar date.
- Make the plan comparison honest and short.
- Check billing friction: failed cards, unclear invoices, extra steps.
How do you avoid misleading yourself?
- Mixing cohorts. This month's paid ÷ this month's signups mixes people who signed up at different times. Use cohorts.
- Counting bots. Exclude non-human traffic, or visitor-to-signup will look worse than it is.
- Testing too many things at once. With a small sample, change one stage at a time.
- Stopping a test when the number looks good. Decide the sample size first; peeking inflates false positives.
- Ignoring segments. An average rate hides that paid search converts at one rate and organic at another. Always split by source.
- Treating a signup as success. Signups that never activate are noise that makes the headline rate look better.
How do you do this in TapCub?
Take the sample funnel and build it on your own data.
- Define the stages as events. Send
signup,activatedandpaidwithtapcub.trackand mark them as goals under Web analytics › Goals. The stage names must match the goal. - Build the funnel. In All-platform analytics › Behavior › Behavior analysis create a funnel with your steps. Set a conversion window (default 7 days, up to 180) and read the rate against step one, the rate against the previous step and the largest drop, which is marked for you.
- Split by source. Break the funnel down by acquisition source, which keeps the 10 groups with the most entries, or open Web analytics › Sources to compare channels. TapCub counts recognised bots separately, so they do not inflate your visitor number.
- Segment and cohort. Use All-platform analytics › Users › Segments & tags to define "signed up in the last 30 days" and carry the segment into funnel and retention analysis.
- See where people stop. For the activation step, check All-platform analytics › Behavior › Heatmaps and Session replay (replay is off by default), and the frustration table under Monitoring › Errors, where a rage click is three clicks on the same element within 500 milliseconds.
- Watch the number after you ship a change. Add a date annotation (Configuration › Annotations) and a monitor for the stage you changed.
TapCub does not split traffic or run A/B tests. If you test two versions of a page elsewhere, send the version name as an event property and compare the stage rates by that property. TapCub measures; the test itself runs in your testing tool.
FAQ
What is SaaS conversion rate optimisation?
It is the work of raising the share of visitors who sign up, activate and pay for a software product, by finding the funnel step where people leave and fixing it. Because the journey has several stages over days or weeks, each stage has its own rate and its own test.
What is a good SaaS conversion rate?
It varies widely by product, price, traffic source and audience, so compare with your own previous periods and with the benchmarks in our guide to B2B SaaS conversion rates rather than a single number. A rate is only meaningful alongside the stage it measures and the traffic mix behind it.
Which stage of the SaaS funnel should I optimise first?
The one with the largest plausible lift, the shortest time to measure and the cheapest change. A 20% relative gain at any stage lifts paid customers by 20%, so position does not decide. In the sample, activation needs about 498 signups to test, and paid needs about 3,268 activated users.
How many visitors do I need for a CRO test?
It depends on the baseline and the lift you want to detect. For a signup rate of 4.0% and a hoped-for 4.8% at 5% significance and 80% power, roughly 9,940 visitors per variant. Smaller expected lifts need much larger samples.
How do I measure activation?
Pick one event that predicts retention in your product, such as creating a first project or viewing a first report, and count the share of new signups who do it within 7 days. Avoid vague definitions such as logging in twice.
Sources
- web.dev: Milliseconds Make Millions, checked 2026-11-21
- Think with Google: Page load time statistics, checked 2026-11-21
- NIST/SEMATECH e-Handbook of Statistical Methods: Sample sizes required, checked 2026-11-21
Was this article helpful?
We use your answers to fix and expand this page.
Couldn’t send. Please try again in a minute.
Thanks for the feedback. We’ll use it to improve this page.You’ve already sent feedback on this page. Thanks.

Product Experience Specialist
Explores usability, user journeys, and feature adoption through practical examples of onboarding and everyday product use.