Try it on your own data
Every report in this article is in the free plan. One snippet for web and apps, up to 10 sites.
Start freeCRO testing means running a controlled experiment, usually an A/B test, to see whether a change moves a conversion rate by more than chance. Start where traffic and evidence are strongest, fix the sample size first (13,914 visitors per version to detect +20% on a 3% baseline) and do not stop early.
What you will learn
- Test the step with the most visitors and clear evidence of a leak; opinion-based ideas on low-traffic pages go last
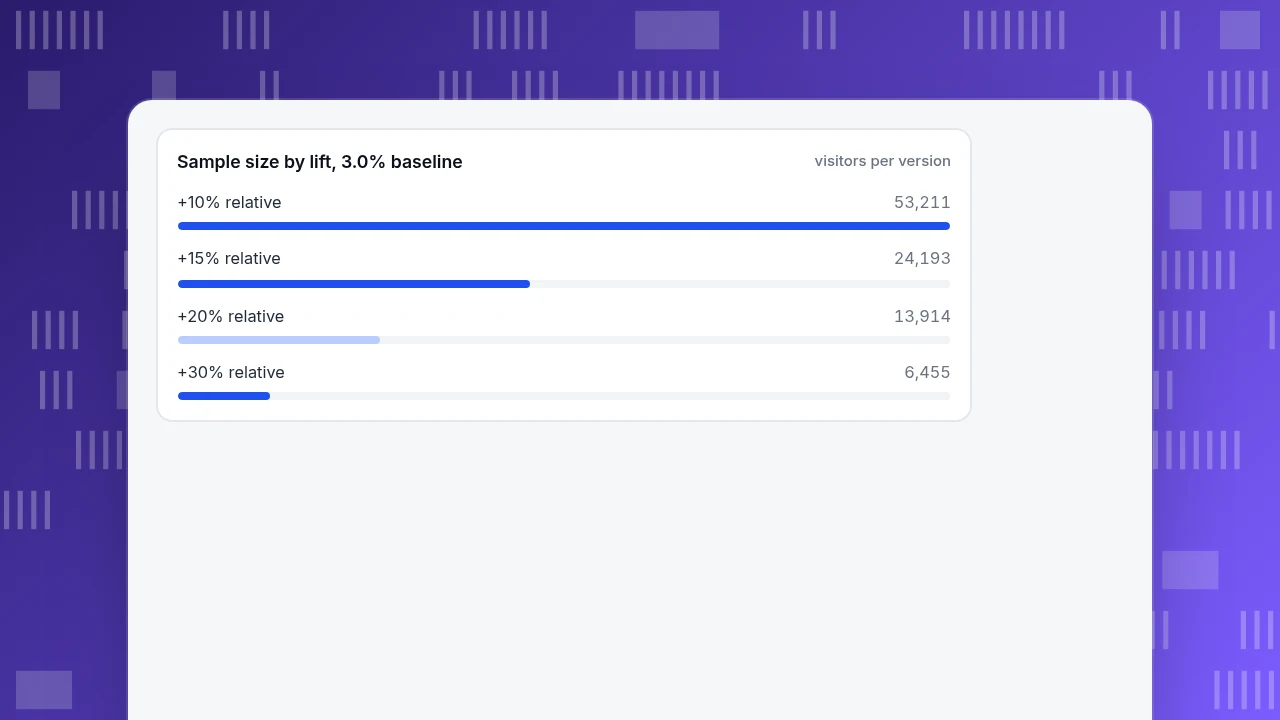
- On a 3% baseline, +10% needs 53,211 visitors per version, +20% needs 13,914 and +30% needs 6,455
- Peeking until it looks good raises false positives to 26.1% in Evan Miller's worst case; fix the sample size first
What a CRO test is, and what it is not
A CRO test is a controlled experiment: you show two versions of one page or step to similar visitors at the same time and compare how many in each group complete the goal. The word "controlled" is doing the work. Two things that are not CRO tests:
- Before and after. You change the page on the 1st and compare with last month. Seasonality, a campaign, a price change or a bot spike can explain the difference, and you cannot separate them from your change.
- Peeking until it looks good. Running a real split but stopping the moment the dashboard turns green. This is covered below, because it is the most common way a valid test becomes an invalid result.
A CRO test answers one narrow question: did this change move this conversion rate by an amount we can tell apart from chance? For the wider process (research, audit, prioritisation) see the conversion rate optimization guide and the CRO audit. For the mechanics of a split test see the A/B testing guide.
What to test first
Test where a lot of people reach a step and a lot of them leave. A tiny gain on a page that 20,000 people a month see is worth more than a big gain on a page 200 see, and it is also the only place where you can reach a verdict in weeks, not months.
Score each idea with three numbers you can get from your own data: monthly visitors to the step, how much of the leak you think the idea can recover, and effort. Sample data:
| Idea | Visitors per month | Step conversion | Evidence | Effort | Priority |
|---|---|---|---|---|---|
| Show shipping cost before checkout | 12,000 | 41% | Steep drop at the shipping step | Low | 1 |
| Shorter sign-up form | 9,000 | 18% | Long time on the form in recordings | Medium | 2 |
| New hero headline | 30,000 | 3% | Opinion | Low | 4 |
| Pricing page layout | 6,000 | 9% | Heatmap shows plan table is skipped | Medium | 3 |
The headline test has the most traffic and the weakest evidence, so it ranks last. Order by evidence first, then by traffic, then by effort. If you cannot name the data that points to an idea, it goes to the bottom.
| Lift to detect | Variant rate | Visitors per version | Visitors in total |
|---|---|---|---|
| +10% relative | 3.30% | 53,211 | 106,422 |
| +15% relative | 3.45% | 24,193 | 48,386 |
| +20% relative | 3.60% | 13,914 | 27,828 |
| +30% relative | 3.90% | 6,455 | 12,910 |
Sample data: 3.0% baseline, 5% significance (two-sided), 80% power, two-proportion normal approximation. Halving the lift roughly quadruples the sample.
Sample size for a 3% baseline: a worked example
Suppose the page converts at 3.0%. How many visitors does each version need before a test can reliably tell it from a better one? That depends on how big a lift you want to detect. The standard two-proportion calculation, at the usual 5% significance (two-sided) and 80% power, gives these per-version sample sizes. (Sample data for the baseline; every figure recalculated in Python.)
| Lift you want to detect | Variant rate | Visitors per version | Visitors in total |
|---|---|---|---|
| +10% relative | 3.30% | 53,211 | 106,422 |
| +15% relative | 3.45% | 24,193 | 48,386 |
| +20% relative | 3.60% | 13,914 | 27,828 |
| +30% relative | 3.90% | 6,455 | 12,910 |
Read it as a price list. Halving the lift you want to detect roughly quadruples the sample, which is why small changes need huge traffic. Detecting a 10% relative lift on a 3% page needs more than 100,000 visitors in total.
You can sanity-check the table without a calculator. Evan Miller suggests the rule of thumb n = 16σ² ÷ δ² per version, where δ is the smallest absolute difference you care about and σ² = p(1 − p) for a conversion rate. For +20%: δ = 0.006, σ² = 0.03 × 0.97 = 0.0291, so n = 16 × 0.0291 ÷ 0.000036 = 12,933. The exact calculation gives 13,914, about 7% more, so the shortcut is a fair first estimate.
Two choices move the numbers. Raising power from 80% to 90% takes the +20% test from 13,914 to 18,626 visitors per version. Loosening the significance level from 5% to 10% takes it down to 10,960, at the price of twice as many false alarms.
Sample size by lift, 3.0% baseline
visitors per versionHow long to run it
Divide the total by the daily traffic that actually sees the test, then round up to whole weeks so every weekday appears the same number of times. For the +20% test (27,828 visitors in total):
| Daily visitors to the tested page | Days needed | Rounded to whole weeks |
|---|---|---|
| 500 | 56 | 56 days (8 weeks) |
| 1,500 | 19 | 21 days (3 weeks) |
| 3,000 | 10 | 14 days (2 weeks) |
Write the stopping point down before launch: "stop when each version has 13,914 visitors, no earlier." If the answer is longer than about six weeks, the test is not worth running at this lift, and the next section gives the alternatives.
Why you must not stop when it looks good
Evan Miller's article on repeated significance testing shows what peeking does. With a 50% baseline and a change that does nothing, stopping at 5% significance after any observation (up to 150) gives a false positive rate of 26.1%, more than five times the nominal 5%. His table of the reported significance you would need to keep the real rate at 5% is:
| Times you look | Significance you must see |
|---|---|
| 1 | 2.9% |
| 2 | 2.2% |
| 3 | 1.8% |
| 5 | 1.4% |
| 10 | 1.0% |
The sample shows how it feels. In the finished example below the final result is clear, but when 40% of the visitors are in (5,600 per version, 168 vs 205 conversions) the p-value is 0.051, right at the edge. A team that checks daily could stop on a lucky day, or abandon a real winner on an unlucky one. The fix is simple: fix the sample size in advance, look only at the end, or use a sequential method designed for early stopping.
What to do when traffic is too low
With 3,000 visitors per version, the smallest lift a 3% baseline can reliably detect is about 1.2 percentage points (the 80%-power, 5% significance minimum detectable effect is about 0.0123), which is a 41% relative lift. Few page changes produce that. You have four honest options:
- Test a bigger change. Replace the whole offer, not a button colour. Large effects are detectable in small samples.
- Test higher up the funnel. Click-through to the next step has a higher base rate than purchase, so it needs fewer visitors. Check that the earlier metric really predicts the later one.
- Pool similar pages. Run the same change across the 10 product pages that share a template.
- Skip the test, use evidence. Fix an obvious bug or broken form without a test. A test is for choices, not for repairs.
How to read the result
Finish the example. The test ran until each version had its planned 14,000 visitors. Control: 420 conversions (3.00%). Variant: 497 conversions (3.55%).
- Absolute difference: 3.55% − 3.00% = +0.55 points; relative lift: +18.3%
- Pooled rate 917 ÷ 28,000 = 3.275%; z = 2.59; two-sided p = 0.0097
- 95% interval for the difference: +0.13 to +0.97 points
Three habits make the read honest. State the interval, not only the winner: the true lift could be as small as +0.13 points. Check the traffic split matches your plan (a 50/50 split that arrives as 52/48 means something is broken in assignment). And do not slice the result into ten segments until one is significant; with ten slices one will look significant by chance about 40% of the time at a 5% threshold (1 − 0.95¹⁰ ≈ 40%).
Measuring the test around your testing tool in TapCub
Take the shipping-cost idea from the table: 12,000 visitors a month, 41% reaching the next step. TapCub does not run A/B tests or split traffic, so you need a separate testing tool for assignment. What TapCub does is measure the pages before, during and after.
- Find the step to test. In All-platform analytics › Behavior › Behavior analysis, build the checkout funnel and read the step with the largest drop. This is the evidence column in the table above.
- Look at why. Check All-platform analytics › Behavior › Heatmaps (clicks, scroll) for the page, and All-platform analytics › Behavior › Session replay if you have switched it on (it is off by default).
- Fix the baseline. Define the goal in Web analytics › Goals and read its conversion rate over the last 4 to 8 weeks. That is the 3.0% you plug into the sample size.
- Record the variant. If your testing tool exposes the variant, send it with a custom event, for example
tapcub.track('checkout_view', { variant: 'B' }), so you can filter a funnel step on that property and compare the two versions on the same goal. - Mark the launch. Add a date note in Configuration › Annotations, so a later chart shows when the test started and ended.
- Keep bots out of the denominator. TapCub counts human and bot traffic separately, so crawler hits do not dilute the conversion rate you compare.
FAQ
What is CRO testing?
It is running a controlled experiment, usually an A/B test, to see whether a change to a page or step moves a conversion rate by more than chance. It does not include before and after comparisons, which cannot separate your change from everything else that changed.
How long should a CRO test run?
Until each version reaches the sample size you calculated before launch, rounded up to whole weeks. For a 3% baseline and a +20% lift that is 13,914 visitors per version, which is 14 days at 2,000 daily visitors. Never stop just because the result looks significant.
What sample size do I need for a conversion test?
It depends on baseline, the lift you want to detect, significance and power. At a 3% baseline, 5% significance and 80% power: 53,211 per version for +10%, 24,193 for +15%, 13,914 for +20%, 6,455 for +30%.
What should I test first?
The step with the most visitors and the clearest evidence of a leak, such as a funnel step with a steep drop, a heatmap that shows a skipped element or recordings of failed attempts. Opinion-based ideas on low-traffic pages go last.
Can TapCub run my A/B test?
No. TapCub does not do A/B experiments or traffic splitting. It measures funnels, goals, heatmaps and sources around the test, and can record a variant you send as a custom event property.
Sources
- Evan Miller: How Not To Run An A/B Test, checked 2026-11-20 (26.1% false positive rate, peeking table, n = 16σ²/δ²)
- Evan Miller: Sample Size Calculator, checked 2026-11-20 (inputs: baseline, minimum detectable effect, power, significance)
Was this article helpful?
We use your answers to fix and expand this page.
Couldn’t send. Please try again in a minute.
Thanks for the feedback. We’ll use it to improve this page.You’ve already sent feedback on this page. Thanks.

Product Analyst
Focuses on event analysis, conversion funnels, and retention, using clear metric definitions and structured analysis to explain product performance.