Try it on your own data
Every report in this article is in the free plan. One snippet for web and apps, up to 10 sites.
Start freeConversion rate optimization (CRO) is raising the share of visitors who complete a goal by finding where they drop out, testing a fix and keeping what works. The loop has six steps (measure, find the leak, diagnose, prioritise, test, decide), and the step that matters most is the fourth: in our sample funnel, ranking four ideas by expected extra purchases puts a shipping-cost message (180 orders a month) ahead of a product-page redesign (90).
What you will learn
- CRO is a six-step loop; the ordering step decides the result, because traffic limits you to a few tests a quarter
- Rank ideas by people at the step × step rate × expected lift × share who then buy: 180, 144, 90 and 54 extra purchases in the sample
- Fix errors and slowness instead of testing them, size every test beforehand (2.3 weeks for the shipping idea, 23 weeks for speed) and write the decision rule before you start
What is CRO, and how is the conversion rate calculated?
Conversion rate optimization (CRO) is the practice of raising the share of visitors who complete a chosen action by finding where they drop out, testing a fix, and keeping the changes that measurably work. The rate itself is conversions divided by visitors. Sample data: 1,800 orders from 60,000 product-page visitors in a month is 1,800 ÷ 60,000 = 3.0%. The word "visitors" matters: dividing by sessions gives a lower number than dividing by unique visitors if people return, so pick one denominator and keep it for every test. For the definition on its own, see conversion rate optimization.
CRO is a loop, not a checklist of tricks. Each pass has the same shape: measure, find the biggest leak, work out why, test one fix, decide, and write down what you learned. The rest of this guide walks one pass with numbers you can recompute.
What are the steps of a CRO cycle?
| Step | Question it answers | Output |
|---|---|---|
| 1. Measure | What is the rate today, and for which goal? | A baseline with a date range and a denominator |
| 2. Find the leak | Which step loses the most people? | A funnel with the biggest drop marked |
| 3. Diagnose | Why do people leave there? | Evidence: reasons, recordings, support questions, speed data |
| 4. Prioritise | Which idea is worth testing first? | A ranked list with expected extra conversions |
| 5. Test | Does the change work? | A result with an interval, after a pre-set sample |
| 6. Decide and log | Ship, iterate or stop? | A written record of the hypothesis and the result |
Most guides stop at "test everything". The step that separates a program that compounds from one that churns is step 4: with limited traffic you can run only a few tests a quarter, so the order matters more than the count.
How do you find the biggest leak in the funnel?
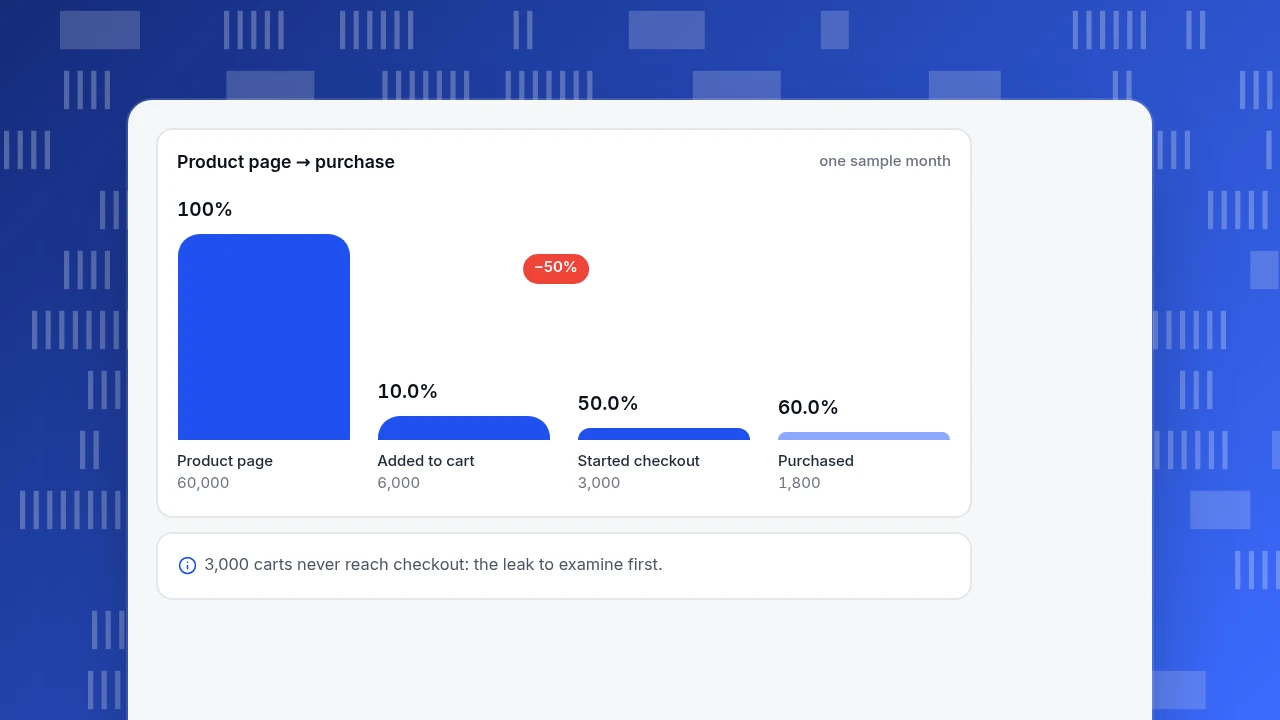
Put the steps from first page to purchase in a funnel and look at each step-to-step rate. Sample data: one month of an online shop.
| Step | Visitors | Step rate | Of those who entered |
|---|---|---|---|
| Product page | 60,000 | 100% | |
| Added to cart | 6,000 | 10.0% | 10% |
| Started checkout | 3,000 | 50.0% | 5% |
| Purchased | 1,800 | 60.0% | 3% |
The product page to cart step loses the most people in absolute terms (54,000), but that is normal: most visitors are browsing. The leaks worth examining are the ones where people have already shown intent. Cart to checkout keeps only 50%, so 3,000 carts are abandoned, and checkout to purchase loses another 1,200. The checkout is where a fix pays back fastest, because every person there has already chosen a product.
Baymard Institute's meta-analysis of 50 published studies from 2006 to 2025 puts the average documented cart abandonment rate at 70.22%, which makes this sample typical rather than alarming: 1,800 of 6,000 carts end in a purchase, so 70% are abandoned. What matters is why.
Product page → purchase
one sample monthProduct page
60,000
Added to cart
6,000
Started checkout
3,000
Purchased
1,800
Why do people leave, and what test follows from each reason?
Baymard also lists the reasons US online shoppers gave for abandoning an order (excluding "just browsing"). Each maps to a testable change:
| Reason shoppers gave (Baymard) | Share | Test idea |
|---|---|---|
| Extra costs (shipping, tax, fees) too high | 40% | Show the total cost earlier, on the product or cart page |
| Delivery too slow | 20% | State delivery dates; add a faster option |
| Did not trust the site with card details | 19% | Trust signals near the payment fields |
| Had to create an account | 18% | Add guest checkout |
| Checkout too long or complicated | 17% | Remove fields; show progress |
| Site errors or crashes | 17% | Fix, do not test (see speed below) |
| Return policy unsatisfactory | 13% | Put the return policy in the cart |
Shares are of respondents who selected each reason; respondents could select several, so they do not sum to 100%. Use the list to generate hypotheses, then confirm with your own data: check whether the abandoned carts in your funnel skew to certain sources, devices or countries, and whether your support questions mention the same reason.
How do you rank test ideas by funnel drop-off and traffic?
Rank by expected extra purchases per month: the people at that step × the step rate × the relative lift you expect × the share of those people who go on to buy. Sample data, using the funnel above; the lifts are assumptions you should replace with your own estimates.
| Idea | Step | People | Rate | Assumed lift | Extra at step | Extra purchases |
|---|---|---|---|---|---|---|
| Show shipping cost in the cart | Cart to checkout | 6,000 | 50.0% | +10% | 300 | 180 |
| Add guest checkout | Checkout to purchase | 3,000 | 60.0% | +8% | 144 | 144 |
| New add-to-cart area (delivery promise, button copy) | Product page to cart | 60,000 | 10.0% | +5% | 300 | 90 |
| Speed up the product page | Product page to cart | 60,000 | 10.0% | +3% | 180 | 54 |
The "extra purchases" column multiplies the extra people at each step by the share who finish from there: 300 extra checkouts × 60% = 180 purchases; 300 extra carts × 30% (1,800 ÷ 6,000) = 90. The ranking is 180, 144, 90, 54. The product page redesign with the largest audience ranks third, because a small lift on a low step rate yields fewer purchases than a modest lift where intent is already high.
Pair the ranking with a feasibility check: ideas that need a developer for six weeks drop down the list even if they rank high. And add a confidence note: an idea backed by two data sources (abandonment reasons and your own support tickets) goes above an idea backed by opinion.
| Idea | Step | Assumed lift | Extra purchases a month | Weeks to test |
|---|---|---|---|---|
| Show shipping cost in the cart | Cart to checkout | +10% | 180 | 2.3 |
| Add guest checkout | Checkout to purchase | +8% | 144 | 4.6 |
| New add-to-cart area | Product page to cart | +5% | 90 | 8.4 |
| Speed up the product page | Product page to cart | +3% | 54 | 23.0 (ship, do not test) |
Sample data: funnel of 60,000 product-page visitors, 6,000 carts, 3,000 checkouts, 1,800 purchases; lifts are assumptions; weeks at the step's monthly traffic, two variants, 80% power.
Should you test speed, or just fix it?
Fix first. A Deloitte study commissioned by Google, "Milliseconds Make Millions", monitored 37 European and American brand sites with over 30 million user sessions for 30 days at the end of 2019 and found that a 0.1-second improvement in mobile site speed raised retail conversion by 8.4%, and travel conversion by 10.1%. The 8.4% figure comes from a specific set of sites and time and will not transfer to yours, but the direction is a good reason to treat clear slowness as a bug.
Google's Core Web Vitals give targets: Largest Contentful Paint within 2.5 seconds, Interaction to Next Paint of 200 milliseconds or less, and Cumulative Layout Shift of 0.1 or less, each measured at the 75th percentile of page loads. If your pages miss them, fix that before you design a copy or layout test. The arithmetic also argues against testing it: in the ranking above, the speed idea needs about 159,000 visitors per variant to detect a +3% lift on a 10% step, which is 23 weeks of the whole product-page traffic. Ship the fix, check the metric before and after, and treat it as observational.
How much traffic and time does your chosen test need?
Take the top idea: showing shipping cost in the cart, to lift cart-to-checkout from 50.0% to 55.0% (+10%). With a two-sided 5% significance level and 80% power, the standard two-proportion formula gives 1,565 carts per variant, so 3,130 in total. At 6,000 carts a month (about 1,381 a week), that is 2.3 weeks. Evan Miller's rule of thumb, n = 16σ²/δ² with σ² = 0.5 × 0.5 and δ = 0.05, gives 1,600, within 3% of the exact figure.
Compare the second-ranked idea: guest checkout, 60.0% to 64.8%, needs 1,598 people per variant and 4.6 weeks at 3,000 checkouts a month. The third, the add-to-cart area, needs 57,763 per variant and 8.4 weeks of the full product-page traffic. So the plan for the quarter writes itself: shipping cost first (2.3 weeks), guest checkout second (4.6), the product-page area third (8.4), which together fill about 15 weeks, and the speed work ships in parallel as a fix.
Two rules protect the result. Fix the sample size and the metric before you start; and read the result once at the end. In Evan Miller's simulation, stopping a test the first time it reached 5% significance, or after 150 observations, declared a winner 26.1% of the time when the new variant did nothing.
How do you decide and document the result?
Use a rule written before the test, not after it.
| Result | Decision |
|---|---|
| The interval is above zero and the lift is at least what you needed to justify the change | Ship, then watch the metric for two weeks |
| The interval includes zero | No evidence of an effect: do not ship on hope; iterate on the idea or stop |
| The interval is below zero | Revert; record why it likely failed |
| The primary metric rose but the next step fell | Treat as a loss; the guardrail metric won |
Log six things for each test: the hypothesis, the evidence behind it, the metric and denominator, the sample size, the dates (with campaign and holiday dates noted) and the result with its interval. A year of these entries tells you which kinds of change work on your site, and it stops the same idea being re-tested by the next person.
How do you run a CRO cycle in TapCub?
TapCub gives you the measurement half of the cycle. It does not split traffic or run A/B tests, so use your testing tool to serve the variants, and use TapCub to find the leak and read the outcome.
- Define the goal in Web analytics › Goals (the same data as All-platform analytics › Business › Goals). The rate divides by unique visitors in the selected dates, which settles the denominator question from the start.
- Build the funnel in All-platform analytics › Behavior › Behavior analysis: up to 20 steps, each an event or a page path, with a conversion window that defaults to 7 days. The result shows the count, the rate versus step one and versus the previous step, drop-off and median time, and marks the largest drop. In the sample, it would mark cart to checkout.
- Diagnose the leak. Break the funnel down by source or device, and watch recordings or heatmaps on the step (session replay is off by default and has to be turned on).
- Mark each change on the chart under Configuration › Annotations, and set the test's start and end dates, so later trends are not misread.
- Read the goal's conversion before and after, by source and device. Treat the comparison as observational unless your testing tool randomised the traffic.
FAQ
What does CRO stand for?
CRO stands for conversion rate optimization: improving the percentage of visitors who complete a goal, such as a purchase or signup, through research and tested changes. It focuses on getting more from existing traffic, rather than buying more of it.
How do you calculate the conversion rate?
Divide conversions by visitors and multiply by 100. In the sample, 1,800 orders from 60,000 visitors is 3.0%. Use one denominator, unique visitors or sessions, consistently, because the two give different numbers and mixing them breaks comparisons.
What is a good conversion rate?
There is no single benchmark; rates differ by industry, device, traffic source and offer. Use your own baseline and compare the same funnel step over time. A more useful question than "is 3.0% good?" is "which step in our funnel is lowest relative to similar intent?"
How long does a CRO test take?
Until it reaches the sample you computed beforehand. In the sample, the shipping-cost test needs about 2.3 weeks; the add-to-cart area needs 8.4. Run whole weeks, and do not stop at the first significant reading.
Where should you start with CRO?
Start with the funnel step just before the conversion, such as the cart and checkout, where visitors have already shown intent. Fix errors and slowness first, then test ideas ranked by expected extra conversions.
See also: CRO Testing: What to Test First and How Many Visitors You Need.
Sources
- Baymard Institute. Cart Abandonment Rate Statistics — 70.22% average from 50 studies (2006 to 2025), with the list of reasons US shoppers gave. Verified 2026-11-20.
- Deloitte and 55 for Google. Milliseconds Make Millions — 37 brand sites, over 30 million sessions; 0.1 s faster mobile speed raised retail conversion by 8.4%. Verified 2026-11-20.
- Google. Web Vitals — LCP 2.5 s, INP 200 ms and CLS 0.1 thresholds at the 75th percentile. Verified 2026-11-20.
- Miller E. How Not To Run an A/B Test — the 26.1% false-positive example and the n = 16σ²/δ² rule of thumb. Verified 2026-11-20.
Was this article helpful?
We use your answers to fix and expand this page.
Couldn’t send. Please try again in a minute.
Thanks for the feedback. We’ll use it to improve this page.You’ve already sent feedback on this page. Thanks.

Product Experience Specialist
Writes about product experience, practical workflows, and growth, turning complex processes into clear steps for everyday decisions.