Try it on your own data
Every report in this article is in the free plan. One snippet for web and apps, up to 10 sites.
Start freeConversion analysis breaks a conversion rate into the channels, devices and funnel steps behind it, so you can see where visitors are lost and which group changed. Fix one conversion and one denominator, compare two periods, split by channel and device, separate traffic mix from conversion rate, check the change is not noise, then follow the funnel inside the weak segment. In the worked month below the total fell 0.32 points while all six segments held or rose.
What you will learn
- A total can fall while every segment rises: in the example, mix cost 0.60 points and rates gained 0.28, so the net was −0.32
- Split by channel and device together, not one at a time, and check each move against a 95% interval before acting
- Start the funnel review where the weak segment differs from a healthy one (here product view and add to cart), not at checkout
What is conversion analysis?
Conversion analysis is the work of splitting a conversion rate into the groups of visitors and the steps that produced it, so you can say where conversions are lost and which group changed. A single site-wide rate answers "how are we doing?" but not "where do we fix it?". The method below has seven steps: fix the definition, set a baseline, split by channel and device, separate mix from rate, check noise, follow the funnel inside the weak segment, and look for the cause.
It differs from conversion tracking, which is about recording the events correctly in the first place, and from conversion funnel optimization, which starts after you know which step to work on. This guide covers the diagnosis in between, using one worked month of sample data.
Step 1: Fix one conversion and one denominator
Pick a single conversion (a purchase, a signup, a demo request) and write down the denominator before you open a report. The same event gives different "rates" depending on what you divide by:
- Per session: conversions ÷ sessions. Sensitive to how often the same person returns.
- Per visitor: people who converted ÷ distinct people. One person counts once, however many visits it took.
Neither is wrong, but mixing them is. In the sample below the unit is the session, and every figure uses it. If a colleague quotes a rate from another report, ask which denominator it used before comparing the two numbers.
Also decide what is excluded. Automated traffic is large: Imperva's 2025 Bad Bot Report puts automated requests at 51% of all web traffic in 2024, and bots in the denominator make every rate look lower and every trend noisier. Count only human sessions.
Step 2: Set a baseline and a comparison window
Conversion analysis is a comparison, so you need two periods of equal length that are comparable: this month against last month, or this week against the same week a year ago if your business is seasonal. Avoid comparing a period that contains a sale with one that does not.
Sample data for the rest of this guide: an online store, 30,000 human sessions in each of two consecutive months.
| Month 1 | Month 2 | Change | |
|---|---|---|---|
| Sessions | 30,000 | 30,000 | 0 |
| Orders | 840 | 744 | −96 |
| Conversion rate (orders ÷ sessions) | 2.80% | 2.48% | −0.32 pt (−11.4% relative) |
The headline says conversion fell by 11.4%. The next steps ask why.
| Step | What to do | Rule of thumb |
|---|---|---|
| 1. Define | One conversion, one denominator, humans only | Write the denominator down before comparing numbers |
| 2. Baseline | Two comparable periods of equal length | Do not compare a sale period with a normal one |
| 3. Split | Channel × device, with share of sessions | Cross the cuts; single cuts hide the cause |
| 4. Decompose | Rate effect vs mix effect | Σ share₂ × Δrate and Σ Δshare × rate₁ |
| 5. Check noise | 95% interval per segment | Overlap means do not report a change |
| 6. Funnel | Compare weak and healthy segment step by step | Start where the rates differ |
| 7. Cause | Entry pages, scroll, clicks, replays | Write a testable hypothesis, then test |
Sample data in the article: 30,000 sessions per month.
Step 3: Split by channel and device
Channel and device are the first two cuts to try because they differ most in intent and in how the page behaves. Split the same two months three ways and compare each group's rate and share of sessions.
By device:
| Device | Month 1 sessions | Month 1 rate | Month 2 sessions | Month 2 rate |
|---|---|---|---|---|
| Desktop | 18,000 | 4.00% (720 orders) | 12,000 | 4.40% (528 orders) |
| Mobile | 12,000 | 1.00% (120 orders) | 18,000 | 1.20% (216 orders) |
Both devices improved, yet the total fell. The mobile share of sessions went from 40% to 60%. Now cross channel and device, because a single cut can hide the cause:
| Segment | M1 sessions | M1 rate | M2 sessions | M2 rate |
|---|---|---|---|---|
| Paid social, desktop | 3,000 | 2.00% | 1,800 | 3.00% |
| Organic search, desktop | 9,000 | 4.00% | 6,000 | 4.40% |
| Email, desktop | 6,000 | 5.00% | 4,200 | 5.00% |
| Paid social, mobile | 3,000 | 0.50% | 7,500 | 0.60% |
| Organic search, mobile | 6,000 | 1.00% | 6,000 | 1.50% |
| Email, mobile | 3,000 | 1.50% | 4,500 | 1.80% |
| All | 30,000 | 2.80% | 30,000 | 2.48% |
Every one of the six segments is flat or up, but the total is down. By channel alone it looks different: email fell from 3.83% to 3.34% (345 orders on 9,000 sessions, then 291 on 8,700) even though email did not get worse on either device. Paid social mobile grew from 3,000 to 7,500 sessions, which is 25% of all traffic in month 2, up from 10%, and it converts at 0.6%.
Step 4: Separate the mix effect from the rate effect
When the total moves, there are two possible reasons: the groups converted differently (rate effect), or the traffic moved toward groups that convert less (mix effect). Compute both on the device split:
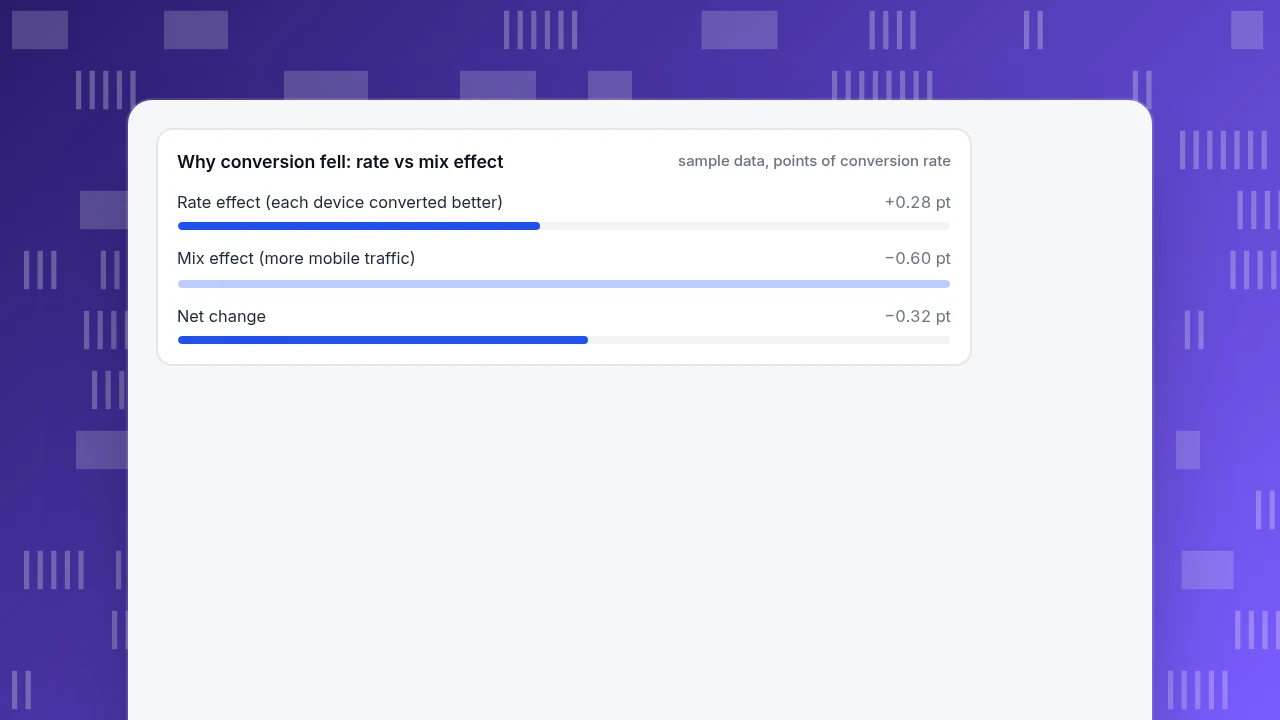
- Rate effect = Σ (month 2 share × change in rate) = 0.40 × (4.40 − 4.00) + 0.60 × (1.20 − 1.00) = 0.16 + 0.12 = +0.28 pt
- Mix effect = Σ (change in share × month 1 rate) = (0.40 − 0.60) × 4.00 + (0.60 − 0.40) × 1.00 = −0.80 + 0.20 = −0.60 pt
- Net = +0.28 − 0.60 = −0.32 pt, matching the headline.
Read it as: the pages did slightly better for each visitor group, and the traffic mix cost twice as much. Nothing is "broken"; the money question is whether the new traffic was worth buying. The pattern, where a total moves the opposite way to every subgroup, is Simpson's paradox. The best-known real case is Bickel, Hammel and O'Connell's 1975 study of 1973 Berkeley graduate admissions, in which men's overall admission rate was 44% against 35% for women while the department-level data showed no bias against women. See the Simpson's paradox glossary entry for the general idea.
The mix effect is also the reason to keep the segments and not stop at "mobile is worse". Mobile did not get worse; more of the traffic arrived through a source that converts poorly on mobile.
Why conversion fell: rate vs mix effect
sample data, points of conversion rateStep 5: Check whether the change is real
Small segments move by chance. A rate from 15 orders can swing a lot between months with no change in the page. Use a 95% interval for a proportion; NIST's engineering handbook recommends the Wilson form, which stays sensible for small counts.
| Check | Month 1 | Month 2 | Verdict |
|---|---|---|---|
| All traffic, 2.80% vs 2.48% | 2.62–2.99% | 2.31–2.66% | Difference 0.32 pt, 95% interval 0.06–0.58 pt, z = 2.4: real but modest |
| Paid social mobile, 0.50% vs 0.60% | 0.30–0.82% | 0.45–0.80% | Intervals overlap almost completely: do not report an improvement |
| Organic search mobile, 1.00% vs 1.50% | 0.78–1.28% | 1.22–1.84% | Nearly separate: probably a real gain |
Two rules follow. First, do not celebrate or investigate a move in a segment whose interval overlaps last month's. Second, the all-traffic drop is statistically visible only because 30,000 sessions sit behind each month; with a tenth of the traffic the same drop would be noise.
Step 6: Follow the funnel inside the weak segment
Now take the segment that matters most, paid social on mobile in month 2, and compare its funnel with a healthy neighbour, organic search on mobile:
| Step | Paid social, mobile | Organic search, mobile |
|---|---|---|
| Sessions | 7,500 | 6,000 |
| Viewed a product | 3,000 (40.0%) | 3,300 (55.0%) |
| Added to cart | 180 (6.0% of viewers) | 330 (10.0%) |
| Started checkout | 90 (50.0%) | 165 (50.0%) |
| Purchased | 45 (50.0%) | 90 (54.5%) |
| Overall | 0.60% | 1.50% |
The gap opens in the first two steps: 40% against 55% reaching a product, and 6% against 10% adding to cart. Checkout is almost the same in both. If you had started from the checkout page you would have spent weeks on a step that is not the difference. Cart-to-purchase is 45 of 180, or 25%, which means 75% of carts are abandoned; Baymard's aggregate of 50 studies puts the average documented cart abandonment rate at 70.22%, so this store sits near the normal range there.
Size the prize before you commit: lifting paid social mobile from 0.6% to 1.0% is worth 7,500 × 0.4 percentage points = 30 orders a month, about +0.10 pt on the total.
Step 7: Look for the cause, then test it
The numbers say where, not why. For early drop-off the usual suspects are a mismatch between what the ad promised and what the landing page shows, a slow or awkward mobile product page, and a product grid that hides the offer. Gather evidence for each before changing anything:
- Compare entry pages for the weak segment against the healthy one. If the ads all land on a long category page, that is the first lead.
- Watch where mobile visitors tap and how far they scroll on that entry page.
- Replay a handful of sessions from the segment to see what they did before they left.
If the drop were at checkout instead, Baymard's survey of US shoppers lists extra costs at 40%, a slow delivery estimate at 20%, forced account creation at 18% and a long or complicated checkout at 17% as reasons for abandoning, which gives a ready checklist. Those figures describe abandoned checkouts, not early drop-off, so do not apply them to the product-page gap above.
Write the hypothesis as a testable sentence, such as "Paid social mobile visitors leave because the landing page opens on a grid, not the advertised product." Fix it, then compare the same segment before and after with the same denominator.
How to run this in TapCub
Take the sample store above and follow the same seven steps with the reports TapCub already has.
- Define the goal. In Web analytics › Goals, create an event goal for the purchase. The goal rate there is distinct visitors who completed it divided by distinct visitors in the range. The conversion rate on the data report is conversions divided by sessions, and the two should not be compared directly, so pick one and note it.
- Compare two periods. Set the date range and switch the comparison to the previous period. Bots and AI crawlers are counted on their own report (Web analytics › Bots), so they do not sit in the denominator.
- Split by channel and device. In Web analytics › Sources, the Channels tab shows visitors, sessions and conversions for each channel. Click a row to filter, and the other reports narrow to that channel. Selecting a goal row on the Goals page also breaks its conversions down by source, entry page, country and device.
- Run the funnel. In All-platform analytics › Behavior › Behavior analysis, build a funnel of landing page, product view, add to cart, checkout start and purchase. Breakdown keeps the 10 largest groups, and there is no compare-period option, so run it once per date range. Each step shows the rate against step one and against the previous step, and the largest drop is marked.
- Look for the cause. Open the entry page in All-platform analytics › Behavior › Heatmaps (clicks, scroll reach, elements) and, if you have turned it on, Session replay, which is off by default.
TapCub does not run A/B tests or split traffic, so the test of the fix happens in your own tooling; TapCub measures the before and after with the same goal and segments.
Common mistakes in conversion analysis
- Stopping at the total. In the example the total fell while all six segments held or rose.
- One cut at a time. Device alone said "mobile grew", channel alone said "email fell"; only the cross showed paid social on mobile.
- Trusting small segments. A move from 15 to 45 orders in a segment with 3,000 and 7,500 sessions is inside the noise.
- Mixed denominators. Visitors in one report, sessions in another.
- Starting at checkout. Checkout is the most visible step and often not where segments differ.
- Explaining with no evidence. "Mobile UX" is a guess until a heatmap or replay shows it.
FAQ
What is conversion analysis in simple terms?
It is the process of breaking a conversion rate into segments and funnel steps to find where visitors drop out and which group changed. You compare two periods, split by channel and device, and check whether the shift comes from rates or from traffic mix.
What should I analyse first when conversion drops?
Check the definition and the denominator, then compare the share of traffic by channel and device between the two periods. A traffic mix change is faster to confirm than a page problem, and it explained −0.60 pt of the −0.32 pt net move in the example.
How do I know a segment's change is not random?
Compute a 95% interval for each period's rate and see whether they overlap. In the sample, paid social mobile's 0.50% and 0.60% overlapped almost completely, while the all-traffic drop had a 0.06 to 0.58 pt interval.
How many segments should I look at?
Start with channel and device and the cross of the two, which gave six cells here. More cuts split the orders into groups too small to read, so add a cut only when the first ones leave the cause unexplained.
Does conversion analysis tell me why visitors do not convert?
It tells you where and for whom. The why needs evidence from behaviour (scroll, clicks, replays) and a fix that you test afterwards.
Sources
- Baymard Institute: 50 cart abandonment rate statistics (average 70.22%, reasons for abandonment), checked 2026-11-20
- Bickel, Hammel and O'Connell (1975), Sex bias in graduate admissions: data from Berkeley, Science 187(4175)
- NIST/SEMATECH e-Handbook of Statistical Methods: confidence intervals for a proportion (Wilson interval)
- Imperva 2025 Bad Bot Report: automated traffic at 51% of web traffic in 2024, checked 2026-11-20
Was this article helpful?
We use your answers to fix and expand this page.
Couldn’t send. Please try again in a minute.
Thanks for the feedback. We’ll use it to improve this page.You’ve already sent feedback on this page. Thanks.

Product Experience Specialist
Explores usability, user journeys, and feature adoption through practical examples of onboarding and everyday product use.