Try it on your own data
Every report in this article is in the free plan. One snippet for web and apps, up to 10 sites.
Start freeContent tracking means recording what people do on a page after it loads. For an article, track three signals together: scroll depth, read time and call-to-action (CTA) clicks. Each one misleads alone, so write them into a tracking plan with triggers and properties, then read clicks per viewer who reached the CTA, not per pageview. The worked 2,000-view example below shows an end CTA at 7.5% per reached viewer against 5.0% for a middle one.
What you will learn
- Track scroll depth, read time and CTA clicks together; each alone can mislead, as the 79% scanners finding from NN/g shows
- Write a tracking plan first: event, trigger, properties and owner, with the same name for the same action everywhere
- Divide CTA clicks by the viewers who reached the button: 7.5% vs 5.0% for end vs middle, though per view they look equal
What is content tracking?
Content tracking is recording what people do with a piece of content after the page loads: how far they scroll, how long the page stays in front of them, and whether they click the next step. A pageview only says that the page was requested. Tracking adds the three signals that separate a read from a bounce, which are scroll depth, read time and call-to-action (CTA) clicks. This guide gives a sample tracking plan for an article page, a worked example with numbers, and the rules for reading the result. For the wider set of metrics, see content performance metrics.
Which three signals matter, and what does each one miss?
Each signal answers a different question, and each can mislead on its own:
| Signal | Question it answers | What it misses |
|---|---|---|
| Scroll depth | How much of the page reached the screen? | Whether anyone read it. A fast flick to the bottom counts the same as a slow read |
| Read time | How long was the page in front of the visitor? | Whether they were looking. Tabs left open in the foreground add time |
| CTA click | Did they take the next step? | Why not, when they did not. Only people who saw the button could click it |
Two published findings explain why you need more than one. Nielsen Norman Group's 1997 study found that 79% of test users always scanned a page and only 16% read word by word. Its 2018 eye-tracking study of 120 participants found that people spent about 57% of their viewing time above the fold and about 17% on the second screenful, and that 74% of viewing time fell within the first two screenfuls. Deep scroll alone therefore tells you less about reading than it seems to.
The default in at least one popular tool is also coarse. Google Analytics 4's enhanced measurement fires its scroll event only the first time a visitor reaches the bottom of a page, when 90% vertical depth becomes visible, so you cannot see where in between people stopped.
What does a sample tracking plan for an article page look like?
A tracking plan is a list of the events you intend to collect, with their trigger and properties, written before anyone adds code. Here is one for a blog article page.
| Event | Trigger | Properties | Source |
|---|---|---|---|
| Pageview | Page load or route change | URL, title, referrer | Collected automatically |
| Time on page | The visitor leaves, switches tab or closes the page | Duration in milliseconds | Collected automatically, sent only if the page was open for more than 1 second |
| Scroll reach | The visitor scrolls the page | Depth reached, page path | Scroll depth switch in autocapture |
cta_click | A click on a tracked CTA button or link | cta_id, placement, article_slug | Custom event |
| Outbound click | A link to another domain | Link host | Collected automatically |
| File download | A link to a document or archive | File path | Collected automatically |
newsletter_signup | The signup form succeeds | placement, article_slug | Custom event |
Three naming rules keep the plan usable. Use snake_case for custom events. Give the same action the same name wherever it happens, and never rename an event once it holds data. Keep properties to the ones you will break down by: placement and article_slug are enough to answer "which CTA, on which article". Do not put raw text that visitors typed into a property.
| Event | Trigger | Properties |
|---|---|---|
| Pageview | Page load or route change | URL, title, referrer |
| Time on page | Visitor leaves or hides the tab | Duration in ms |
| Scroll reach | Visitor scrolls the page | Depth, page path |
| cta_click | Click on a tracked CTA | cta_id, placement, article_slug |
| Outbound click / file download | Link to another domain or a file | Link host or file path |
| newsletter_signup | Signup form succeeds | placement, article_slug |
Sample tracking plan for one article page; custom events in snake_case.
Worked example: one article, 2,000 views
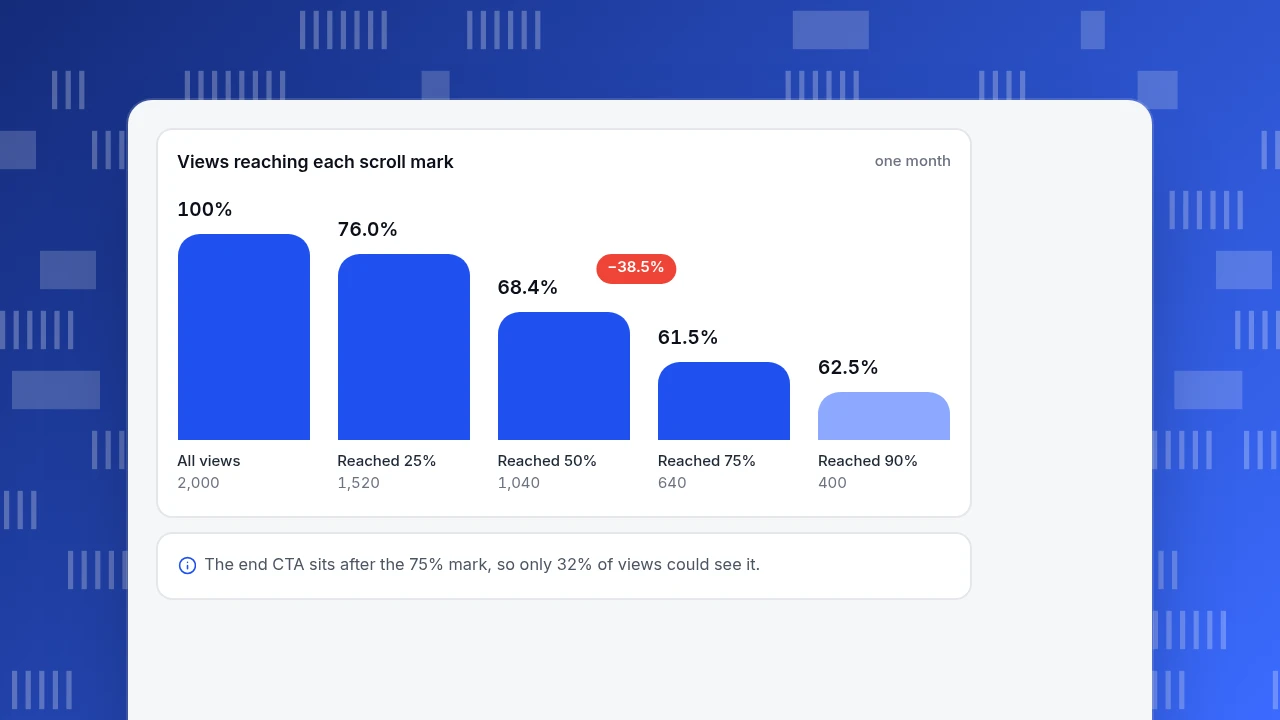
Sample data for one 1,800-word article, viewed 2,000 times in a month. Scroll marks are the share of views that reached each depth.
| Scroll band | Views that stopped in this band | Share of views | Median time on page |
|---|---|---|---|
| Under 25% | 480 | 24.0% | 12 s |
| 25% to under 50% | 480 | 24.0% | 41 s |
| 50% to under 75% | 400 | 20.0% | 118 s |
| 75% or more | 640 | 32.0% | 310 s |
The views that reached each mark are therefore 1,520 at 25% (76.0%), 1,040 at 50% (52.0%), 640 at 75% (32.0%) and 400 at 90% (20.0%).
Now the read time. At an editorial planning pace of 250 words a minute (an assumption for the example, not a measured fact), 1,800 words takes 432 seconds. Readers who reached 75% or more spent a median of 310 seconds, which is 72% of that. Those who stopped between 50% and 75% spent 118 seconds, which is 27%. The first group looks like readers; the second looks like people checking whether the page is useful.
Views reaching each scroll mark
one monthAll views
2,000
Reached 25%
1,520
Reached 50%
1,040
Reached 75%
640
Reached 90%
400
How do you read a CTA click rate?
The same clicks give different rates depending on the denominator. The article has two CTAs: one after the 50% mark and one after the 75% mark.
| CTA | Clicks | Views that could see it | Rate per view | Rate per viewer who reached it |
|---|---|---|---|---|
| Middle | 52 | 1,040 | 2.6% | 5.0% |
| End | 48 | 640 | 2.4% | 7.5% |
| Both | 100 | 2,000 | 5.0% | n/a |
Per view, the two look the same (2.6% against 2.4%). Per person who got far enough to see them, the end CTA is 50% better (7.5% against 5.0%), yet the middle one collected more clicks (52 against 48) because more people reached it. That is the useful decision: the end CTA has the stronger offer for its audience, and the middle one has the larger audience.
Treat "reached the depth" as an upper bound on "saw the button". The page may have been tall on a phone and short on a desktop, so compare placements within one device when you can.
Where should the scroll marks go?
Quarter marks (25, 50, 75, 90) are a fine default for a first read. After that, move one mark to the place your content changes: the end of the answer block, the first CTA, the start of the comparison table. A mark at "75%" means something different on a 600-word post and a 4,000-word guide, but "reached the table" means the same on both. Keep the marks few. Four or five give a curve; ten give a crowd of near-identical numbers. In TapCub the depth bands are the ones on the Scroll reach tab; a content-based mark such as "reached the table" needs a custom event fired by your own code.
What do you do with the numbers?
Put the decision rules in the plan itself, so the next review has an action to take:
| If you see | It probably means | Do this |
|---|---|---|
| Under 35% reach the first CTA | The CTA is too low for this page | Move it up or shorten the lead-in |
| High reach, low click per reached viewer | The visitors are there, the offer or wording is not | Change the CTA text or the offer, not the position |
| Deep scroll, short time | Skimming | Add subheadings and a summary near the top |
| Long time, low scroll | Tab left open or slow reader | Check by device; do not count it as engagement |
| Reach falls sharply at one mark | A dense or confusing block | Split or rewrite that section |
Review monthly with at least a few hundred views per article. With 2,000 views, 52 clicks gives a rate you can compare. With 50 views, one extra click changes the rate by two points.
How to set this up in TapCub
Using the article plan above:
- Plan the events. In All-platform analytics › Data › Tracking plan, add rows for
cta_clickandnewsletter_signupwith their trigger, properties (name, type, required), an owner and a status. The plan records events you intend to collect, including ones not sent yet. - Turn on scroll depth. Pageviews and time on page are collected by the script by default. Scroll depth is off until you enable it in autocapture on Web analytics › Configuration › SDK code, and autocapture needs the Pro plan or higher.
- Send the CTA event. Call
tapcub.track('cta_click', { cta_id: 'end-of-post', placement: 'end', article_slug: 'content-tracking' })from the button's click handler. It appears in Web analytics › Events and in All-platform analytics › Behavior › Event analysis. - Verify. Open the plan row and turn on live verification (last 24 hours). You see how many events arrived and how complete the required properties are.
- Read the result. All-platform analytics › Behavior › Heatmaps has a Scroll reach tab: each row is the share of visits that reached that depth or further, and the page list shows the average maximum scroll depth at leave. Web analytics › Pages shows average time on page. For the click rate per viewer who reached the CTA, build a funnel in Behavior analysis from the article page to
cta_click.
Two limits to state. Time on page is sent when the visitor leaves or the tab is hidden, so a tab left in the foreground still adds time. And TapCub measures the visit; it does not change the content or run A/B tests of the CTA wording.
What are the common content tracking mistakes?
- Counting only pageviews. They cannot tell a read from a bounce.
- One signal, one verdict. Scroll depth or time on page alone is ambiguous, as the table above shows.
- Renaming events. A new name starts an empty history.
- Dividing by all views. A CTA below the fold has a smaller audience; use the reached denominator.
- Tracking everything. Ten events with no decision attached make a dashboard nobody reads.
FAQ
What should I track on a blog article?
Scroll depth at a few marks, time on page, CTA clicks with a placement property, and outbound clicks and downloads where you link out. Add one signup or goal event so you can see what happens after the click.
How do I track scroll depth?
Record when a visitor passes set depths, for example 25, 50, 75 and 90%. Default settings in some tools record only one depth, so check which marks yours collect.
Is time on page a good measure of reading?
Only with context. It is measured while the page is open and visible, so an idle tab adds time. Pair it with scroll depth and compare it with the expected read time of the article, as in the example.
How many views do I need before the numbers mean something?
Aim for at least a few hundred views per article per review. Below that, one click swings the rate by a point or more.
What is the difference between content tracking and content performance metrics?
Tracking is the collection: the events and properties. Performance metrics are what you compute from them, such as reach and click rate per viewer.
Sources
- Google Analytics Help: Enhanced measurement events (scroll fires at 90% vertical depth), checked 2026-11-20
- Nielsen Norman Group: Scrolling and attention (2018, 120 participants), checked 2026-11-20
- Nielsen Norman Group: How users read on the web (1997), checked 2026-11-20
- Google Analytics Help: User engagement time, checked 2026-11-20
Was this article helpful?
We use your answers to fix and expand this page.
Couldn’t send. Please try again in a minute.
Thanks for the feedback. We’ll use it to improve this page.You’ve already sent feedback on this page. Thanks.

Customer Experience Consultant
Writes about live chat, visitor conversations, and self-service, sharing practical ways to make customer communication clearer and more effective.