Try it on your own data
Every report in this article is in the free plan. One snippet for web and apps, up to 10 sites.
Start freeCRO content is page copy you change on purpose to raise one conversion rate, then test against a number: start with the headline, the button label, the benefit bullets, the proof, the pricing copy and the form microcopy, and give each a metric and a sample size. The headline in our sample needs 10,317 visitors per variant to detect a +20% lift on a 4.0% baseline, so the question is not only what to test but what you can afford to read.
What you will learn
- Every copy test needs a named metric, a baseline and a sample size decided in advance: 10,317 per variant for headline 4.0% to 4.8%, 4,862 for a form step at 25% to 27.5%
- Lower baselines and smaller lifts cost the most traffic; with 500 visitors a week and a 3.0% baseline, +20% needs 55.7 weeks, so test a bigger change or a higher-rate step
- Read the interval, not just the winner: 4.0% vs 4.6% gave p = 0.022 with a 95% interval of +0.09 to +1.11 points, and stopping early inflates false positives to 26.1% in one simulation
What counts as CRO content?
CRO content is any words on a page that you change on purpose to raise the share of visitors who take a specific action, and then measure against a number. It is not "better writing" in general. It is a short list of copy elements, each tied to one metric: the headline, the sub-headline, the benefit bullets, the button label, the proof, the objection answers, the form instructions and the error messages. If a copy change has no named metric and no baseline, it is an edit, not a test.
The test of whether you are doing CRO content: before you write the new version, can you state the current rate, the rate you hope for, and how many visitors it will take to tell the difference? The rest of this guide gives you that for six common elements. The wider process (research, funnel, prioritisation) is in CRO audit; this page is only about the words.
Which copy elements should you test, and how many visitors does each need?
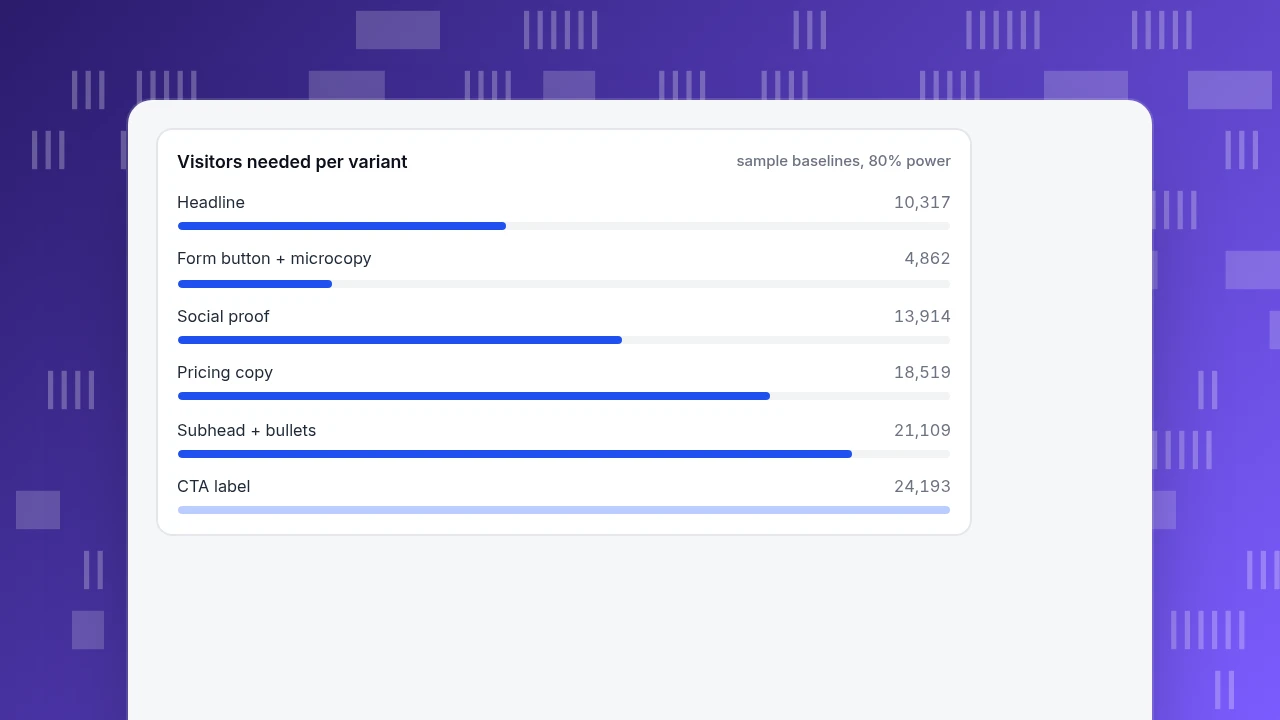
Start with the elements that every visitor sees before they decide, and pair each with one primary metric. The table gives a realistic target and the visitors you need per variant to detect it. Sample data: the baselines are illustrative; the sample sizes are recomputed for a two-sided 5% significance level and 80% power.
| Copy element | Primary metric | Baseline | Target lift (relative) | Visitors per variant | Weeks at 5,000 visitors per week |
|---|---|---|---|---|---|
| Headline | Goal conversion on the page | 4.0% | +20% (to 4.8%) | 10,317 | 4.1 |
| CTA button label | Click-through on the button | 3.0% | +15% (to 3.45%) | 24,193 | 9.7 |
| Sub-headline and benefit bullets | Goal conversion on the page | 2.0% | +20% (to 2.4%) | 21,109 | 8.4 |
| Social proof block | Goal conversion on the page | 3.0% | +20% (to 3.6%) | 13,914 | 5.6 |
| Form button and microcopy | Form completion among starters | 25.0% | +10% (to 27.5%) | 4,862 | 1.9 |
| Pricing page copy | Plan selection | 1.5% | +25% (to 1.875%) | 18,519 | 7.4 |
Three things to take from it. First, the smaller the baseline, the more visitors a given relative lift costs: the 1.5% pricing page needs about four times as many visitors per variant as the 25% form step to detect a bigger relative lift. Second, form copy is the cheapest to test because its baseline is high. Third, a CTA label that moves clicks by 15% is expensive to prove, so test a bigger idea (a different offer, not a different verb) unless you have the traffic.
The sample sizes use the standard two-proportion formula. Evan Miller's guide to A/B testing gives a quicker rule of thumb, n = 16σ²/δ², where δ is the smallest absolute change you care about and σ² = p(1 − p) for a conversion rate; for the headline row it gives 9,600 per variant, a little below the 10,317 above, and is good enough for a first estimate.
Visitors needed per variant
sample baselines, 80% powerWhat does the research say about how people read your copy?
People scan before they read. Jakob Nielsen's 1997 study for the Nielsen Norman Group found that 79% of test users always scanned any new page, and only 16% read word by word. The same research tested rewritten versions of the same content against a promotional-style control and measured relative improvements in usability: 58% with concise text, 47% with a scannable layout, 27% with objective rather than promotional language, and 124% with all three combined.
Treat these as hypotheses, not benchmarks. The study is from 1997, measured usability in a lab setting and not conversion, and its numbers will not transfer to your page. What does transfer is the direction: most copy tests that work cut words, put the point first, and replace claims with facts. That gives you candidate variants to test, not a promised lift.
How do you write a copy hypothesis you can actually test?
Use one sentence with five parts: Because [evidence], changing [element] from [current] to [new] will [change in behaviour], measured by [metric], by at least [relative lift].
Example: "Because a scroll heatmap shows visitors scrolling past a vague headline without reading the bullets, changing the headline from 'Smarter analytics for modern teams' to 'See which pages lose visitors, in one dashboard' will increase goal conversion on the page, by at least 20%."
Three rules keep hypotheses honest. The evidence has to exist before the test (a heatmap, a support question, a drop-off), not be invented after. Change one element per test, or you will not know which words did it. And fix the metric and the lift in advance: a result you chose after seeing the data is a story, not a finding. Which metric to pick for each element is in the table above.
| Copy element | Metric | Baseline to target | Visitors per variant |
|---|---|---|---|
| Headline | Goal conversion on the page | 4.0% to 4.8% | 10,317 |
| CTA button label | Click-through on the button | 3.0% to 3.45% | 24,193 |
| Sub-headline and bullets | Goal conversion on the page | 2.0% to 2.4% | 21,109 |
| Social proof block | Goal conversion on the page | 3.0% to 3.6% | 13,914 |
| Form button and microcopy | Form completion | 25% to 27.5% | 4,862 |
| Pricing page copy | Plan selection | 1.5% to 1.875% | 18,519 |
Sample data: baselines illustrative; visitors per variant computed for two-sided 5% significance and 80% power.
How do you read the result of a copy test?
Sample data: a headline test on a signup page, fixed at 12,000 visitors per variant, planned to detect 4.0% → 4.8%.
| Variant | Visitors | Sign-ups | Rate |
|---|---|---|---|
| A (current) | 12,000 | 480 | 4.00% |
| B (new headline) | 12,000 | 552 | 4.60% |
The observed lift is 0.60 percentage points, or +15% relative (0.60 ÷ 4.00). The pooled rate is 1,032 ÷ 24,000 = 4.30%, and the standard error of the difference is √(0.043 × 0.957 × 2 ÷ 12,000) = 0.262 points, so z = 0.60 ÷ 0.262 = 2.29 and the two-sided p-value is 0.022. The 95% interval for the difference is +0.09 to +1.11 points, or roughly +2% to +28% relative.
How to read that: B probably is better, since the interval sits above zero, but the true lift could be anywhere from very small to larger than you planned. The result is below the +20% you hoped for (0.80 points), which is why the interval is wide. Decision rule: ship B if the cost of being wrong is low (a headline is reversible); if you were choosing between this and a costly redesign, treat +2% as the planning figure, not +15%.
Why do copy tests mislead, and how do you avoid it?
- Peeking and stopping early. If you check a running test and stop the moment it looks significant, the false-positive rate is not 5%. In Evan Miller's simulation, stopping at the first sign of 5% significance (or after 150 observations) declared a winner 26.1% of the time when the new variant did nothing. Fix the sample size first and read the result once.
- Testing several things at once. A new headline, button and image together tell you that the page changed, not which words did the work. Test copy elements one at a time unless you have the traffic for a proper multivariate design.
- The wrong metric. A sharper button label can raise clicks and lower purchases if it over-promises. Track the click as the primary metric for a button, but always check the next step as a guardrail.
- Treating the visit as the unit. One visitor can see the page several times. Count unique visitors, as the sample-size table does.
- Ignoring who arrived. A traffic mix that shifts mid-test (a campaign starts, a newsletter goes out) changes the baseline. Note the launch and campaign dates, and compare by traffic source if the mix changed.
What if you do not have the traffic to test?
Check the arithmetic before you build the test. Sample data: a page with 500 visitors a week and a 3.0% baseline conversion. To detect a +20% relative lift (3.0% to 3.6%) you need 13,914 visitors per variant, or 27,828 in total, which is 55.7 weeks at 500 visitors a week. That test cannot be read.
Three options when the arithmetic fails. Test a bigger change: a +50% lift on the same baseline needs far fewer visitors. Test further down the funnel where the rate is higher (form completion at 25% needed only 4,862 per variant for +10%). Or skip the test: ship the change on judgement, watch the metric before and after, and treat the comparison as observational. A fixed-sample test only helps if it can be read within a few weeks.
How do you track a copy test in TapCub?
Take the headline test above. TapCub does not split traffic or serve variants, so run the variants in your testing tool, and use TapCub for the baseline, the guardrails and the record.
- Define the goal in Web analytics › Goals (a page or an event, such as the signup confirmation). The conversion rate is conversions among unique visitors in the chosen dates; read the last 28 days before the test as your baseline, and check it against the 4.0% you assumed.
- See whether people even reach the copy. In All-platform analytics › Behavior › Heatmaps, check scroll depth for the page: a headline that few people read needs a different fix than one that is read and ignored.
- Put the launch on the chart. Add an annotation under Configuration › Annotations on the day the test starts and ends, so a later reader of the trend sees the cause of the change.
- Watch the guardrail. In All-platform analytics › Behavior › Behavior analysis, funnel the signup page to the next step (the confirmation or first use) and check the second step has not dropped while the first rose.
- Segment the read-out. Break the goal down by source or device from the Goals page and look at whether the lift is the same in each, since a mix change can masquerade as a copy effect.
FAQ
What is CRO content?
CRO content is the copy on a page changed on purpose to raise a specific conversion rate, and then measured: headlines, sub-headlines, button labels, benefit bullets, proof and form microcopy. It differs from general content writing by having one metric, a baseline and a pre-planned sample size.
What copy should you A/B test first?
Start with the headline and the primary button label because every visitor sees them before deciding. Next test the sub-headline and benefit bullets, then proof and objection handling. Test forms (button and microcopy) early too, because their higher baselines need far fewer visitors.
How long should a copy test run?
Until it reaches the sample size you calculated in advance, not until the result looks significant. For the headline sample: 10,317 visitors per variant, about 4 weeks at 5,000 visitors a week. Run full weeks so weekday and weekend behaviour are both included.
How many visitors do you need for an A/B test on copy?
It depends on the baseline and the lift you want to detect. For a 4.0% baseline and a +20% relative lift, about 10,300 visitors per variant at 80% power and 5% significance; for 1.5% and +25%, about 18,500. Low baselines and small lifts need the most traffic.
Can you run a CRO content test with low traffic?
Only if the lift you expect is large or the step is high in conversion rate. A page with 500 visitors a week and a 3.0% baseline would need 55.7 weeks to detect +20%. Test a bigger change, test a higher-rate step, or ship on judgement and track before and after.
Sources
- Nielsen J. How Users Read on the Web. Nielsen Norman Group, 30 September 1997 — 79% scanned, 16% read word by word; 58%, 47%, 27% and 124% usability improvements versus a promotional control. Verified 2026-11-20.
- Miller E. How Not To Run an A/B Test — the 26.1% false-positive example and the n = 16σ²/δ² rule of thumb. Verified 2026-11-20.
- Miller E. Sample Size Calculator — baseline rate, minimum detectable effect, power and significance as inputs. Verified 2026-11-20.
Was this article helpful?
We use your answers to fix and expand this page.
Couldn’t send. Please try again in a minute.
Thanks for the feedback. We’ll use it to improve this page.You’ve already sent feedback on this page. Thanks.

Product Analyst
Focuses on event analysis, conversion funnels, and retention, using clear metric definitions and structured analysis to explain product performance.