Try it on your own data
Every report in this article is in the free plan. One snippet for web and apps, up to 10 sites.
Start freeThe main SaaS business models are flat rate, per seat, tiered, usage-based and freemium, and they are best compared on the same three formulas: LTV, LTV to CAC and CAC payback. In the sample, payback stays between 7.9 and 10.2 months in all five, while LTV to CAC ranges from 2.13 to 4.00.
What you will learn
- Five models, one set of formulas: LTV = ARPA × margin ÷ churn; payback = CAC ÷ (ARPA × margin)
- In the sample, payback is similar (7.9 to 10.2 months) but LTV to CAC spreads from 2.13 (freemium) to 4.00 (per seat)
- LTV rests on churn: the flat-rate row falls from 3.27 to 1.96 when churn goes from 3% to 5%
Five SaaS pricing models, defined
A SaaS business model is mostly a pricing model plus a way to acquire customers. The pricing side comes in a handful of standard patterns. Stripe's subscription documentation lists four recurring pricing models, and adding the free-tier pattern gives five that cover most products.
| Model | How the customer pays | What grows revenue per account | Typical example (generic) |
|---|---|---|---|
| Flat rate | One price for a tier such as Basic, Starter or Enterprise | Moving up a tier | A scheduling tool with three plans |
| Per seat | One price per user, each user needs a licence | Adding users | A design or CRM tool charged per editor |
| Tiered | Unit cost changes with quantity (volume) or usage (graduated) | Higher volume at a lower unit price | An email tool priced by contact count |
| Usage-based | Pay for what is used: fixed fee plus overage, pay as you go, or credits that burn down | Using more | A messaging or storage service |
| Freemium | Free tier for many, paid plan for a few | Converting free users | A tool with a free plan and paid upgrades |
The first four are the pricing models Stripe documents; freemium is an acquisition pattern layered on top of any of them. The question is not which model is best, since each suits a different product. It is which numbers each model puts under pressure, so you know what to measure.
| Model | What grows revenue per account | LTV to CAC (sample) | CAC payback (sample) |
|---|---|---|---|
| Flat rate | Moving up a tier | 2.45 | 10.2 months |
| Per seat | Adding users | 4.00 | 10.0 months |
| Tiered | Higher volume at a lower unit price | 3.56 | 9.4 months |
| Usage-based | Using more | 3.60 | 7.9 months |
| Freemium (paid users) | Converting free users | 2.13 | 9.4 months |
Illustrative unit economics for a generic product in each model; replace with your own.
The three formulas behind every comparison
Use the same three formulas for every model so the comparison is fair.
- LTV (lifetime value) = ARPA × gross margin ÷ monthly churn. ARPA is average revenue per account per month. This is a simple form that assumes churn stays constant; treat it as an estimate.
- CAC payback (months) = CAC ÷ (ARPA × gross margin). The months of margin needed to earn back the cost of acquiring a customer.
- LTV to CAC ratio = LTV ÷ CAC. For more on the ratio and its pitfalls, see LTV to CAC ratio.
Expected lifetime in months is 1 ÷ monthly churn, so 4% churn means 25 months and 2.5% means 40.
Comparing the five on one set of sample numbers
Sample data: illustrative unit economics for a generic product in each model. These are assumptions to show how the models differ, not benchmarks; replace them with your own.
| Model | ARPA a month | Gross margin | Monthly churn | CAC | LTV | LTV to CAC | CAC payback |
|---|---|---|---|---|---|---|---|
| Flat rate | $49 | 80% | 4.0% | $400 | $980 | 2.45 | 10.2 months |
| Per seat | $300 (10 seats × $30) | 80% | 2.5% | $2,400 | $9,600 | 4.00 | 10.0 months |
| Tiered | $120 | 80% | 3.0% | $900 | $3,200 | 3.56 | 9.4 months |
| Usage-based | $180 (average) | 70% | 3.5% | $1,000 | $3,600 | 3.60 | 7.9 months |
| Freemium (paid users) | $40 | 80% | 5.0% | $300 | $640 | 2.13 | 9.4 months |
Worked line, per seat: LTV = 300 × 0.80 ÷ 0.025 = $9,600; CAC payback = 2,400 ÷ (300 × 0.80) = 10.0 months; ratio = 9,600 ÷ 2,400 = 4.00. The freemium CAC is spread over paying users: if each free signup costs $12 to acquire and 4% become paid, one paying customer costs 12 ÷ 0.04 = $300.
Read the table for patterns, not for a winner.
- Payback is similar in all five, between 7.9 and 10.2 months. A business can be healthy at very different prices when CAC scales with price.
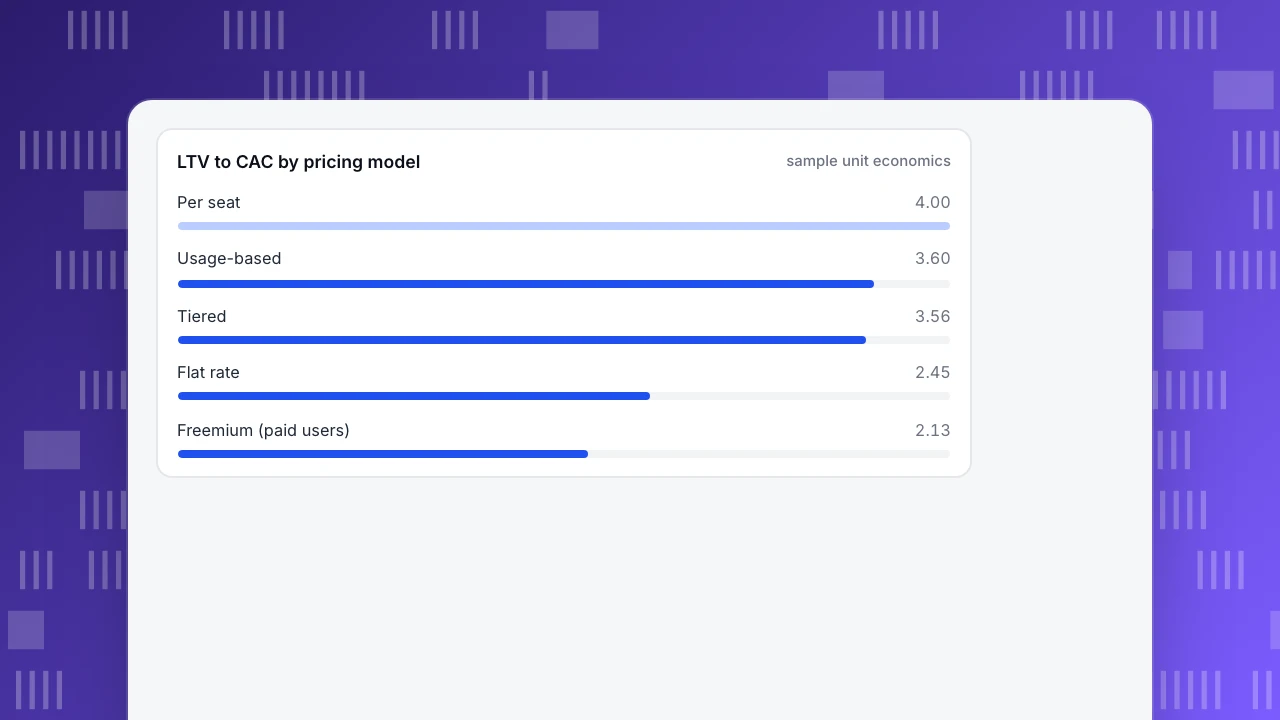
- The ratio spreads wider, from 2.13 to 4.00. Per seat leads because churn is lowest and each account is large; freemium trails because paid churn is highest.
- Usage-based has the fastest payback but the lowest margin. Variable costs rise with use, so margin is lower and revenue less predictable.
LTV to CAC by pricing model
sample unit economicsWhat decides each model's numbers
Each model puts a different input under pressure. Watch the one that matters for yours.
- Flat rate: churn and price point. One price means little room to grow an account, so churn and conversion carry everything. A shift from 4.0% to 3.0% churn moves LTV from $980 to $1,307.
- Per seat: seat count per account. Revenue grows if teams add users and shrinks if they remove them. Track seats per account and the share of accounts that expand.
- Tiered: where customers sit in the tiers. Watch the share on each tier, and how many sit just under a limit.
- Usage-based: how usage trends. Revenue follows use, so a customer who uses less pays less without cancelling. Track revenue per account over time next to churn.
- Freemium: free-to-paid conversion. At 4% a free signup is worth a twenty-fifth of a customer. Moving conversion from 4% to 5% cuts CAC from $300 to $240; moving it to 3% raises CAC to $400.
How sensitive is LTV to the churn you assume?
LTV is a ratio with churn in the denominator, so a small error in churn is a big error in LTV. Take the flat-rate row, with the same ARPA, margin and CAC.
| Monthly churn | LTV = 49 × 0.80 ÷ churn | LTV to CAC at $400 CAC |
|---|---|---|
| 3.0% | $1,307 | 3.27 |
| 4.0% | $980 | 2.45 |
| 5.0% | $784 | 1.96 |
A two-point range in churn moves the ratio from 3.27 to 1.96. Before you present an LTV, show it at three churn rates, and when you can, measure churn on a cohort instead of assuming it. Net revenue retention is the better test for models with expansion: one public cybersecurity company reports a dollar-based net retention rate of 115% as of January 31, 2026, meaning its year-earlier customers paid 15% more in total after churn and contraction. A per-seat or usage-based model can reach that kind of figure; a flat-rate model rarely can.
How much expansion does each model need to hold net retention at 100%?
Churn compounds, so a monthly rate hides a bigger annual loss. Take the share of accounts left after twelve months, (1 − churn) ^ 12, then ask how much each surviving account must grow in revenue for the cohort's revenue to stay level. That figure is 1 ÷ share left − 1. This simplifies by treating account churn as revenue churn.
Sample data, using the churn rates in the comparison table:
| Model | Monthly churn | Accounts left after 12 months | Expansion each survivor needs for 100% net retention |
|---|---|---|---|
| Flat rate | 4.0% | 61.3% | 63.2% |
| Per seat | 2.5% | 73.8% | 35.5% |
| Tiered | 3.0% | 69.4% | 44.1% |
| Usage-based | 3.5% | 65.2% | 53.4% |
| Freemium (paid users) | 5.0% | 54.0% | 85.1% |
Worked line, per seat: 0.975 ^ 12 = 0.738, so 73.8% of accounts remain; 1 ÷ 0.738 − 1 = 35.5%, so each remaining account must pay 35.5% more by month 12. A team that grows from 10 seats to 13.55 seats does it. A flat-rate customer cannot grow without changing tier, so that model has to win net retention by holding churn down. This is why per-seat and usage-based products can report net retention above 100% and flat-rate products usually cannot.
Choosing a model: decision rules
- If value scales with the number of people using it, per seat fits, and expansion comes free as teams grow.
- If value scales with a measurable amount of work done, usage-based fits, but plan for lower margin and revenue swings.
- If your customers are small and want a simple price, flat rate or tiered fits; manage churn and the upgrade path.
- If the product has to be tried to be understood, add a free tier, but price CAC per paying customer as in the freemium row, not per signup.
- If your CAC payback is above 12 months on your own data, change acquisition or price before you scale spend.
In TapCub: measure the model's weak point
TapCub is not a billing system. It does not read subscriptions, compute MRR or churn, or handle payments. It measures the behaviour in front of and inside the product, which is where each model's weak point shows first. For the sample models:
- Acquisition cost. In All-platform analytics › Business › Channel ROI, import spend by day, channel, source or campaign (CSV or one at a time). The page computes cost per click (spend ÷ sessions) and cost per acquisition (spend ÷ purchases in orders), grouped by channel, source or campaign, so you can see which channel's CAC fits the payback you need.
- Freemium conversion. Mark the upgrade page or event as a goal in Web analytics › Goals and compare conversion by source, to see which sources send people who convert.
- Per-seat expansion. After login,
tapcub.group('company', 'acme', {...})groups people into accounts. All-platform analytics › Users › Accounts shows account counts, members, active accounts in 30 days and a 0 to 100 health score. - Usage-based trends. In All-platform analytics › Behavior › Metrics & SQL, define a metric from an event and an aggregation, such as total count or per-person average, and watch it by account over time.
- Retention. Run Retention in All-platform analytics › Behavior › Behavior analysis with signup as the start event and the key action as the return event, and compare cohorts by plan.
Revenue, churn and LTV stay in your billing and finance tools; TapCub supplies the behavioural half.
FAQ
What are the main SaaS business models?
Flat rate, per seat, tiered and usage-based pricing, often with a free tier on top. Each puts a different input under pressure: churn and price point, seat count, tier placement, usage trends, or free-to-paid conversion.
Which SaaS pricing model has the best unit economics?
None wins everywhere. In the sample, per seat has the highest LTV to CAC at 4.00 because churn is low and accounts are large, while usage-based has the shortest payback at 7.9 months. Your own churn and CAC decide, so run the three formulas on your numbers.
How do you calculate LTV for a SaaS product?
LTV = ARPA × gross margin ÷ monthly churn. With $300 ARPA, 80% margin and 2.5% churn, LTV is $9,600. It assumes churn stays constant, so show it at several churn rates and prefer cohort data.
What is a good LTV to CAC ratio?
There is no universal rule; the sample models range from 2.13 to 4.00. Look at it with CAC payback, because a high ratio built on a long payback can still starve cash. Test sensitivity to churn before you rely on it.
Does freemium work for SaaS?
It can, if the free tier brings paying customers at an acceptable CAC. In the sample, 4% conversion at $12 per free signup is $300 per paying customer. If conversion halves, that CAC doubles to $600, so watch conversion closely.
Sources
- Stripe Docs, Recurring pricing models: flat rate, per-seat, tiered and usage-based pricing models and their descriptions. Checked 2026-11-21.
- CrowdStrike Holdings, Form 10-K for the fiscal year ended January 31, 2026: a 115% dollar-based net retention rate as of January 31, 2026. Checked 2026-11-21.
Was this article helpful?
We use your answers to fix and expand this page.
Couldn’t send. Please try again in a minute.
Thanks for the feedback. We’ll use it to improve this page.You’ve already sent feedback on this page. Thanks.

Product Experience Specialist
Explores usability, user journeys, and feature adoption through practical examples of onboarding and everyday product use.