Try it on your own data
Every report in this article is in the free plan. One snippet for web and apps, up to 10 sites.
Start freeThe SaaS customer retention strategies that work are tied to usage and cohorts: raise activation, contact stalled signups by day 7, flag accounts whose usage falls, and track B2B accounts rather than users. In the sample cohort, lifting activation from 40% to 50% keeps 53 more customers per 1,000 signups at month 3.
What you will learn
- Split every cohort by activation: in the sample, activated customers keep 62% at month 3 and the rest 9%
- Price each strategy in customers: activation 40% → 50% is +5.3 points (+53 per 1,000); a day-3 nudge converting 10% is +3.2 points
- A usage-drop flag predicted cancellation at 28% vs 6%, but test every tactic against a comparison group before crediting it
Retention is mostly decided in the first weeks
The strategies that work for SaaS retention start from one observation: customers who reach the first useful result early stay, and those who do not mostly leave. Before choosing a tactic, put your own signups in a cohort table split by activation.
Sample data: 1,000 signups in January. 400 (40%) reached the key first result within seven days and are "activated"; 600 did not. Retention is the share of the cohort still active, measured at month 1, 3 and 6.
| Month | Activated retention | Not activated retention | Activated still active | Not activated still active | Whole cohort |
|---|---|---|---|---|---|
| 1 | 78% | 22% | 312 | 132 | 444 (44.4%) |
| 3 | 62% | 9% | 248 | 54 | 302 (30.2%) |
| 6 | 55% | 5% | 220 | 30 | 250 (25.0%) |
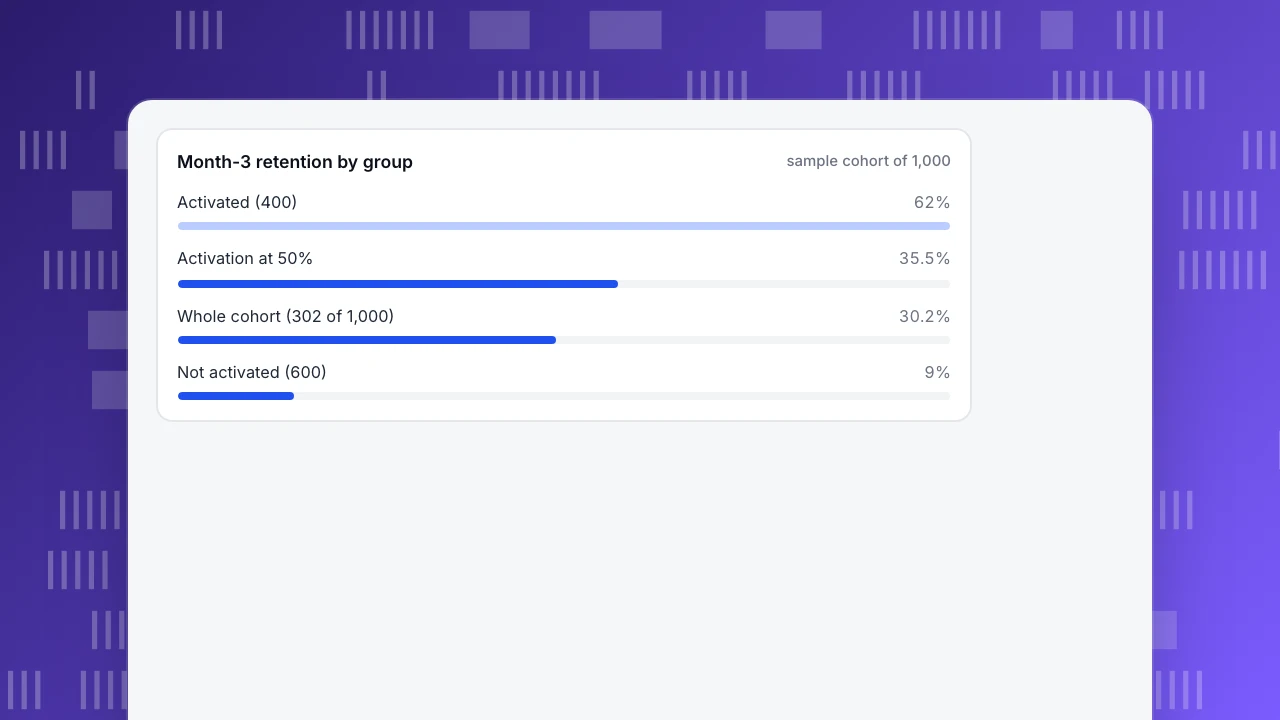
Each customer count is the group size times its rate: month 3 is 400 × 0.62 = 248 and 600 × 0.09 = 54, total 302. The cohort's headline retention of 30.2% at month 3 hides two very different curves: activated customers hold at 62%, the rest are almost gone at 9%. Every strategy below is a way to move people from the lower curve to the upper one, or to hold the upper one up.
Month-3 retention by group
sample cohort of 1,000Strategy 1: raise activation, because it moves the whole curve
If activation drives retention, raising it is the largest lever. Work out what a gain is worth with the numbers above.
Sample data: lift activation from 40% to 50%, with the same retention for each group. Month 3 retention becomes 0.50 × 62% + 0.50 × 9% = 35.5%, against 30.2% now.
- Gain = 35.5% − 30.2% = 5.3 percentage points.
- On 1,000 signups that is 355 − 302 = 53 more customers at month 3.
- At a sample price of $50 a month, 53 customers is $2,650 of monthly revenue kept, every month the cohort stays.
To raise activation, shorten the path to the first result: remove steps that do not lead to it, pre-fill defaults, and put the key action on the first screen. A funnel from signup to the key event shows which step loses the most people. Our guide to user retention strategies covers the general options; here the point is to choose by where the funnel breaks.
Strategy 2: reach stalled signups by day 7
Some signups never activate. A stalled signup is one who signed up but has not done the key event by day 3 or day 5. Contact them before day 7, while the window is open.
Sample data: of the 600 signups who did not activate, a nudge (an email or a message) gets 10% of them, 60 people, to activate. Activation becomes 460 ÷ 1,000 = 46%. Month 3 retention is 0.46 × 62% + 0.54 × 9% = 33.4%, which is 3.2 points above 30.2%, or about 32 more customers.
The rule: if a signup has not done the key event by day 3, send one message that offers the next step, not a feature tour. Use the answers to improve onboarding. Any message must be specific to what that person has not done; a generic "we miss you" email does not reach the cause.
Strategy 3: watch usage drops in active customers
For customers who did activate, the early warning is usage, not complaints. Choose a usage signal that tracks value, such as active days in the last 30, and flag a fall.
Sample data: 2,000 paying accounts. A rule flags accounts whose active days fell from 8 or more in the previous 30 days to 2 or fewer in the latest 30. 200 accounts are flagged; 56 of them (28%) cancel within 60 days. Among the other 1,800, 108 (6%) cancel.
- Cancellation rate, flagged = 56 ÷ 200 = 28%.
- Cancellation rate, not flagged = 108 ÷ 1,800 = 6%.
- Ratio = 28 ÷ 6 = 4.7 times.
A signal this predictive earns outreach. If a call or message saves 20% of the accounts that would have cancelled, that is 56 × 0.20 = 11 accounts a quarter. Check the value of that against the effort, and tune the threshold so the flagged list is short enough to contact. Do not treat the flag as proof of intent: some accounts are seasonal.
Strategy 4: for B2B, track the account, not the user
In B2B SaaS the customer is a company. One champion who logs in daily can hide the fact that nobody else at the account uses the product, and the champion leaving is a common reason an account cancels. Track how many people at each account are active and how recently.
A simple account health rule: count the share of the account's members who were active in the last 30 days, the number of active days, and whether anyone was active in the last 7 days. An account where one of ten seats is active is at higher risk than one where six are, even if both have the same revenue. Treat the health score as a way to order your outreach, then check it against actual cancellations in your own data.
Strategy 5: grow the base so net retention can pass 100%
Gross retention can never exceed 100%, because it counts only losses. Net retention adds expansion, so an account that adds seats or moves to a higher plan can offset others leaving. One public cybersecurity company reports a dollar-based net retention rate of 115% as of January 31, 2026, which means the customers it had a year earlier were paying 15% more in total, after churn and contraction.
For your own product, find the usage that comes before an upgrade, such as hitting a plan limit or inviting colleagues, and make the next step easy at that moment. This is separate from retention of a single customer; define which of the two you are reporting.
What usage data cannot fix: involuntary churn
Some cancellations are not decisions. A card expires, a payment fails and the subscription lapses. These are billing events, and the fixes sit in your payment system: retry rules, expiry reminders and card updates. Usage analytics will show nothing unusual before they happen. Measure involuntary churn separately from voluntary churn so you send each to the right owner.
Match each strategy to a signal, a metric and an owner
| Strategy | Signal that triggers it | Metric to watch | Owner |
|---|---|---|---|
| Raise activation | Funnel drop at one step | Activation rate within 7 days | Product |
| Reach stalled signups | No key event by day 3 | Share who activate after the message | Lifecycle or support |
| Watch usage drops | Active days fall from 8 or more to 2 or fewer | Cancellation rate of flagged vs unflagged | Customer success |
| Account health | Few members active | Active share of members; days since last activity | Customer success |
| Expansion | Plan limit reached; colleagues invited | Net revenue retention | Sales or product |
| Involuntary churn | Failed payment | Recovered share of failed payments | Billing or finance |
| Strategy | Signal that triggers it | Metric to watch | Owner |
|---|---|---|---|
| Raise activation | Funnel drop at one step | Activation rate within 7 days | Product |
| Reach stalled signups | No key event by day 3 | Share who activate after the message | Lifecycle or support |
| Watch usage drops | Active days fall from 8 or more to 2 or fewer | Cancellation rate, flagged vs unflagged | Customer success |
| Account health | Few members active | Active share of members; days since last activity | Customer success |
| Expansion | Plan limit reached; colleagues invited | Net revenue retention | Sales or product |
| Involuntary churn | Failed payment | Recovered share of failed payments | Billing or finance |
Sample thresholds; tune them on your own cohorts.
Do not mistake a correlation for a cause
The cohort table shows that activated customers retain better. It does not prove activation causes retention: motivated customers both activate and stay. The check is a comparison. Show the new onboarding to part of the signups and compare activation and month-3 retention with similar signups who did not see it, or compare cohorts before and after with other things held steady.
Be equally careful with famous claims. A 1990 Harvard Business Review article by Reichheld and Sasser is often summarised as saying that retaining 5% more customers can raise profits by almost 100%; the same summary describes a credit card company whose annual customer losses of 5% were half the industry average. Treat those as a reason to measure your own cohorts, not as a benchmark to promise.
In TapCub: the retention side, from usage
TapCub does not run experiments or send lifecycle email, and it does not read your billing system, so involuntary churn and cancellations live elsewhere. It does give you the usage signals above.
- Build the cohort table. In All-platform analytics › Behavior › Behavior analysis, run Retention with the signup event as the start event and your key event as the return event. Rows are cohorts by start date with a count and rate per period, and a weighted average underneath.
- Split by activation. Create two segments in All-platform analytics › Users › Segments & tags, people who did the key event in the first 7 days and people who did not, and apply each to the retention view. Segments are rules with a window and a count, refreshed daily.
- Find where activation breaks. Build a funnel from signup to the key event (2 to 20 steps, window up to 180 days). Each step shows the count, the drop-off and the median time from the previous step, and the largest drop is marked.
- Flag usage drops. A rule segment can express "did the key event at least N times in the last 30 days" and "did not do it in the last 30 days", so you can list people who were active before and went quiet. Lifecycle shows New, Returning, Resurrecting and Dormant counts by week or month.
- Reach people in the product. Use Live chat › Chat settings › Proactive invites to show an invite on a setup page after a number of seconds. Invites match by page and dwell time, not by segment, so use the page where stalled people stop. For B2B, All-platform analytics › Users › Accounts shows account activity and a health score.
FAQ
What are the best SaaS customer retention strategies?
The ones that follow your data: raise activation, reach signups who stall by day 7, flag accounts whose usage falls, track account health in B2B, create expansion paths, and fix failed payments. Order them by how many customers each moves in your own cohort table.
How do you calculate SaaS customer retention?
Retention for a period is customers still active at the end who were active at the start, divided by customers at the start. For a signup cohort, the share still active at month N. In the sample, 302 of 1,000 are active at month 3, which is 30.2%.
Why does onboarding affect retention so much?
Customers who reach a useful result early tend to keep using the product. In the sample, activated customers keep 62% at month 3 and the rest 9%. That does not prove cause, so test changes with a comparison group.
How do I spot customers about to cancel?
Look for falling usage, such as active days dropping from 8 or more to 2 or fewer in 30 days, and for B2B accounts, few active members. In the sample, flagged accounts cancel at 28% against 6% for the rest.
What is a good SaaS retention rate?
There is no single figure: it depends on customer size, price and what you count. Compare your own cohorts over time instead. Gross retention cannot pass 100%; net retention can, and one public company reports 115% on a twelve-month basis.
Sources
- Bain & Company, Zero Defections: Quality Comes to Services (summary of the 1990 Harvard Business Review article by Reichheld and Sasser): retaining 5% more customers can boost profits by almost 100%; a credit card company loses 5% of customers a year, half the industry average. Checked 2026-11-21.
- CrowdStrike Holdings, Form 10-K for the fiscal year ended January 31, 2026: 115% dollar-based net retention rate as of January 31, 2026. Checked 2026-11-21.
Was this article helpful?
We use your answers to fix and expand this page.
Couldn’t send. Please try again in a minute.
Thanks for the feedback. We’ll use it to improve this page.You’ve already sent feedback on this page. Thanks.

Product Adoption Consultant
Explores customer onboarding, live conversations, and self-service, turning common usage questions into practical guidance and improvements.