Try it on your own data
Every report in this article is in the free plan. One snippet for web and apps, up to 10 sites.
Start freeA good SaaS dashboard is one screen for one role with six numbers or fewer, each with a comparison. A founder board shows the MRR bridge and churn, a product board shows activation and retention, and a support board shows speed and load. In the sample, MRR rose 6.4% to 53,200 while net revenue retention was 98.0%, so the next question was who left.
What you will learn
- One screen, one role, six numbers or fewer, each with a comparison
- MRR bridge: 50,000 + 4,200 + 1,300 − 400 − 1,900 = 53,200; net retention 98.0%
- Give charts at least 3:1 contrast and labels; do not rely on colour alone
What a SaaS dashboard is for
A SaaS dashboard is a single screen that tells one person whether to act today. It is not a report, and it does not hold every metric you can compute. The reliable way to build one is to start from the person and their decision: a founder decides where to put money and time, a product manager decides what to fix in onboarding, and a support lead decides whether to add people to the queue. Each of them needs about six numbers, each with a comparison (last period, a target, or both). This article shows three layouts with sample data you can recompute, then the rules that make them readable. Metric definitions are on the SaaS metrics page and layout theory in dashboard design principles.
| Role | Decision | Top-row numbers |
|---|---|---|
| Founder | Where to put money and time | MRR, gross MRR churn, net retention, signup rate, activation |
| Product | What to fix in onboarding | Activation, WAU/MAU, week-4 retention, feature adoption |
| Support | Whether to add people | Conversations, resolution rate, first reply, KB hit rate |
Layouts are examples; keep the definition of each number in a text block on the board.
Four rules before you draw anything
- One screen, one audience. If two roles need different numbers, build two boards.
- Six numbers or fewer in the top row. More than that and nobody can say which one matters.
- Every number carries a comparison: last period, target, or both. A bare "53,200" tells you nothing.
- Every number has an owner and an action. If no one would do anything differently when it moves, remove it.
Founder dashboard: revenue, churn, and where growth comes from
Founders need the revenue picture and the top of the funnel. Start with the MRR bridge, which explains how monthly recurring revenue changed. Stripe defines MRR as the monthly-normalised value of subscriptions being collected, so an annual subscription of 1,200 counts as 100 a month, and trials are not included.
Sample data for one month:
| Line | Amount |
|---|---|
| MRR at start of month | 50,000 |
| New MRR (new customers) | +4,200 |
| Expansion MRR (upgrades) | +1,300 |
| Contraction MRR (downgrades) | −400 |
| Churned MRR (cancellations) | −1,900 |
| MRR at end of month | 53,200 |
Check: 50,000 + 4,200 + 1,300 − 400 − 1,900 = 53,200. From that bridge you get three numbers:
- Net new MRR = 53,200 − 50,000 = 3,200, or growth of 6.4% (3,200 ÷ 50,000).
- Gross MRR churn = (400 + 1,900) ÷ 50,000 = 4.6%.
- Net revenue retention = (50,000 + 1,300 − 400 − 1,900) ÷ 50,000 = 98.0%.
A net retention under 100% means existing customers shrink even before you add new ones; growth then depends on new MRR. The top row of the founder board is: MRR, gross MRR churn, net revenue retention, visit-to-signup rate, activation rate. A second row shows signups by source for the month, so the founder can see whether growth leans on one channel that could dry up next month.
| Metric | This month | Last month | Change |
|---|---|---|---|
| MRR | 53,200 | 50,000 | +6.4% |
| Gross MRR churn | 4.6% | 3.9% | +0.7 points |
| Net revenue retention | 98.0% | 99.1% | −1.1 points |
| Visit → signup rate | 5.0% | 4.6% | +0.4 points |
| Activation rate | 47.0% | 44.0% | +3.0 points |
Reading it: growth is coming from the funnel (signup and activation both up) while churn is also up, so the next question is who left, not how to get more traffic.
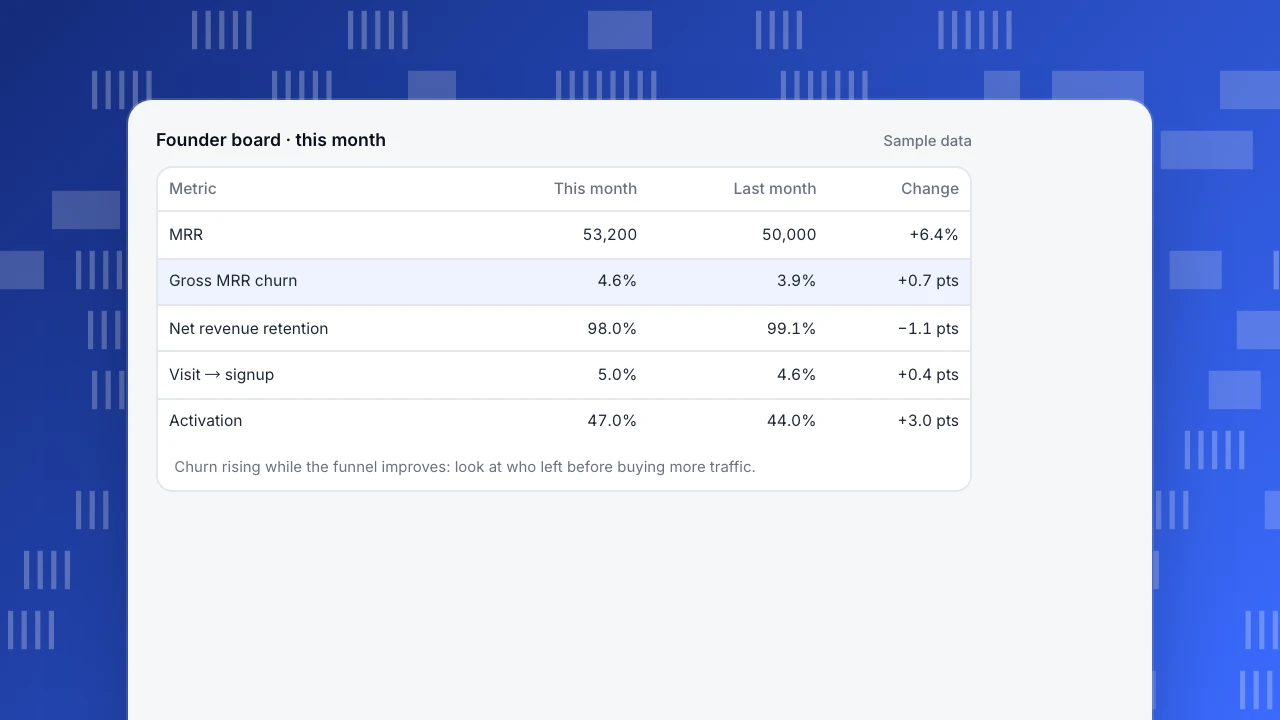
Founder board · this month
Sample data| Metric | This month | Last month | Change |
|---|---|---|---|
| MRR | 53,200 | 50,000 | +6.4% |
| Gross MRR churn | 4.6% | 3.9% | +0.7 pts |
| Net revenue retention | 98.0% | 99.1% | −1.1 pts |
| Visit → signup | 5.0% | 4.6% | +0.4 pts |
| Activation | 47.0% | 44.0% | +3.0 pts |
Churn rising while the funnel improves: look at who left before buying more traffic.
Product dashboard: activation, usage and retention
A product manager's board answers "are new users reaching value, and do they come back?" Sample data for one week:
| Metric | Value | How it is computed |
|---|---|---|
| New signups | 1,000 | Count in the week |
| Activated within 7 days | 420 (42.0%) | 420 ÷ 1,000 |
| Monthly active users | 5,200 | Distinct users with any event in 30 days |
| Weekly active users | 2,340 (45.0% of MAU) | 2,340 ÷ 5,200 |
| Week-4 retention | 22.0% | Of the signup cohort four weeks ago, share active in week 4 |
| Feature adoption (key feature) | 38.0% of active users | Users who used it ÷ active users |
The layout that works: the top row shows these six numbers with last week beside each; below it, a funnel from signup to activation with the biggest drop highlighted; and a retention curve by signup week so you see whether newer cohorts do better than older ones. Add a text block that defines "activated" in one line, because the number is meaningless if the definition changes.
Support dashboard: speed, load and what customers ask
A support lead decides about staffing and about what to fix in the product. Sample data for one week:
| Metric | Value | Why it is on the board |
|---|---|---|
| Conversations | 420 | Load |
| Resolution rate | 85.0% (357 ÷ 420) | Quality |
| Median first human reply | 2.4 minutes | Speed |
| Knowledge-base hit rate | 31.0% (130 ÷ 420) | How much the help content answers on its own |
| Satisfaction | 4.4 out of 5, from 120 ratings | Experience, with the rating count so small samples are visible |
| Top page where chats start | Pricing, 31% of chats | Where the product confuses people |
The last row connects support to product: if a third of conversations start on the pricing page, that page is missing an answer. Put it next to the load number so the person deciding on staffing also sees what to fix.
Layout rules that make the board readable
- Order by importance, top-left first. The number the owner acts on most often goes in the top-left.
- One chart per question. Lines for time, bars for comparison, a funnel for steps; avoid dual axes.
- Show the comparison next to the value, not in a tooltip.
- Do not rely on colour alone. The Web Content Accessibility Guidelines (success criterion 1.4.11) require graphical parts needed to understand content to have at least a 3:1 contrast ratio with adjacent colours. Add labels to bars and lines so the information is also available as text.
- Define each number once, in a text block on the board: formula, window, and source.
- Limit refresh and time range controls. One date range for the whole board prevents cards that quietly disagree.
Five dashboard mistakes and how to spot them
| Mistake | How it shows up | Fix |
|---|---|---|
| Too many cards | Nobody can say which number matters; the board is opened once a month | Cut to six in the top row; move the rest to a second board |
| Numbers without comparison | People ask "is that good?" in every meeting | Add last period and target next to each value |
| Mixed definitions | Two cards say "active users" with different windows | One text block defining each term; reuse the same saved analysis |
| Averages that hide segments | Overall rate flat while one source collapses | Add one breakdown card (source or device) beneath the top row |
| Vanity numbers | Total signups ever, total page views ever | Replace with rates and per-period values that can fall |
A quick test of any card: cover the number and ask what decision it would change. If you cannot name one, delete it.
Build one in an afternoon: a five-step routine
- Name the reader and the decision in one sentence ("The support lead decides whether to add a person to the queue").
- List candidate numbers and cross out everything that does not change that decision. Keep six at most.
- Write the definition of each, with formula and window, before opening any tool. Use the calculations above as a template: the MRR bridge, the activation ratio, the resolution rate.
- Build the cards and compare with a second source (for example the billing tool for MRR, or your database for signups) using the gap check from reliable data. Do not publish a card that has never been reconciled.
- Review after two weeks. Ask the owner which cards they opened and what they did. Remove cards nobody used, and add at most one new card per review.
A dashboard that is used weekly and trusted is worth more than a beautiful one nobody opens. Treat the board as a product with a user: schedule a review, collect feedback and keep a changelog so numbers do not change silently.
How to do it in TapCub
Build the product board above in TapCub, using what TapCub measures:
- Create the analyses. In All-platform analytics › Behavior › Behavior analysis build the signup-to-activation funnel and a retention analysis, and save each. Custom measures such as weekly active share can be defined in All-platform analytics › Behavior › Metrics & SQL.
- Assemble the board. In All-platform analytics › Overview › My dashboards, add saved analyses as cards, plus a text block for definitions and dividers. A board has its own date range and filters and can be set as the default.
- Add the support numbers. Live chat › Reports shows conversations, resolution rate, first response (human replies only) and knowledge-base hit rate, and Live chat › Reports › Conversion attribution lists where chats start.
- Share read-only. A dashboard share link is read-only, can have a password, and shows at most the last 90 days.
- Get notified. All-platform analytics › Operations › Monitors can notify you when a saved metric crosses a threshold; it only notifies.
TapCub measures product, traffic and chat behaviour. It does not read your billing system, so keep the MRR bridge in your billing tool or a spreadsheet and place it beside the TapCub cards, rather than expecting TapCub to calculate MRR or churn from payments.
FAQ
What should be on a SaaS dashboard?
Six numbers or fewer for one audience, each with a comparison. For founders: MRR, gross MRR churn, net revenue retention, signup rate and activation. For product: activation, active users, retention and feature adoption.
What is the difference between a founder and a product dashboard?
A founder board shows revenue and where growth comes from; a product board shows whether new users reach value and return. They use different numbers and different decisions.
How do you calculate net revenue retention?
(Starting MRR + expansion − contraction − churn) ÷ starting MRR. In the sample, (50,000 + 1,300 − 400 − 1,900) ÷ 50,000 = 98.0%.
How many metrics should a dashboard have?
Six in the top row. Each should carry a comparison and an owner who would act when it moves.
How do I make dashboard charts accessible?
Give graphical elements at least 3:1 contrast with their background and add labels, so the information does not depend on colour alone.
How often should a SaaS dashboard be reviewed?
Review it two weeks after launch and then quarterly. Ask each owner which cards they opened and what they did, remove unused cards, and add at most one new card per review so the board stays readable.
Sources
- Stripe Help, Understanding Monthly Recurring Revenue (MRR) and Annual Recurring Revenue (ARR) (annual subscription of 1,200 counts 100 towards MRR; trials excluded).
- W3C, Understanding Success Criterion 1.4.11: Non-text Contrast (3:1 contrast for graphical objects).
- TapCub documentation, Save, dashboards and share (docs.tapcub.com), checked 2026-11-21.
Was this article helpful?
We use your answers to fix and expand this page.
Couldn’t send. Please try again in a minute.
Thanks for the feedback. We’ll use it to improve this page.You’ve already sent feedback on this page. Thanks.

Customer Experience Consultant
Writes about live chat, visitor conversations, and self-service, sharing practical ways to make customer communication clearer and more effective.