Try it on your own data
Every report in this article is in the free plan. One snippet for web and apps, up to 10 sites.
Start freeSaaS landing pages share one structure: a hero, proof, benefits, how it works, a product visual, a price signal, testimonials, an FAQ and a final call to action. Lists of examples show the look but no conversion data, so this guide breaks the structure into nine sections, shows three layouts by goal, and gives a scroll-reach table you can recompute, with the number to watch for each section.
What you will learn
- Give every section one visitor question to answer and one number that shows it works
- Reorder the same nine sections by the action the page wants: start free, book a demo or read the docs
- Check scroll reach: in the sample only 16% of visits reach the last section, so the primary CTA belongs in the hero
Why don't lists of SaaS landing page examples tell you what converts?
Roundups of SaaS landing pages are chosen on taste. A page earns a place because it looks sharp or comes from a known brand, and none of them publishes its conversion rate. Copying a layout because it appears in a list copies the look, not the result. Even teams that measure find that most ideas fail: at Microsoft, only about one third of the ideas tested improved the metric they were built to improve (Kohavi et al., KDD 2013).
So this article does something different. It takes the structure that SaaS landing pages share, breaks it into sections, and for each section says what question it must answer, what evidence it needs and which number tells you it works. The three example structures below are composites, not screenshots of real companies, and the sample figures are illustrative. For tooling to test changes, see landing page optimization tools; for what a good rate looks like, see landing page conversion rate.
What sections does a SaaS landing page have, and what must each prove?
Nine sections cover almost every SaaS page. Each earns its place by answering one visitor question:
| # | Section | Visitor question it answers | Evidence it needs | Number to watch |
|---|---|---|---|---|
| 1 | Hero | "Is this for me, and what does it do?" | Outcome, audience, primary action | Primary CTA click rate |
| 2 | Social proof strip | "Do people like me use it?" | Customer type, count, or named logos you have permission to show | Scroll reach past it |
| 3 | Problem and benefits | "Does it fix my problem?" | Three outcomes, not features | Scroll reach, time on section |
| 4 | How it works | "How hard is it to start?" | Three steps, ideally with time | CTA clicks from this section |
| 5 | Product visual | "What will I actually see?" | Real interface, not a mock-up | Scroll reach, clicks on the visual |
| 6 | Pricing teaser | "What will it cost me?" | A starting price or a free tier | Clicks to the pricing page |
| 7 | Testimonials | "Does it work for someone like me?" | Quote, role, a specific result | Reach |
| 8 | FAQ | "What stops me from signing up?" | Answers to the top objections | FAQ opens, chat starts |
| 9 | Final CTA | "What do I do now?" | One repeated action | CTA click rate |
Order matters less than coverage: a visitor who cannot find the answer to a question leaves with it. The one rule of order is that the hero must answer question 1 before anything else.
| Structure | Primary CTA | Signal metric |
|---|---|---|
| Self-serve product | Start free | Signup start rate; activation downstream |
| Demo-led B2B | Book a demo | Demo form completion; qualified share |
| Developer tool | Read the docs or install | Docs click rate; first-call success |
Composite structures, not real pages; the section order changes with the CTA.
Which three structures do SaaS pages follow?
These composites show how the same nine sections are reordered by what the page asks the visitor to do. All three are illustrative.
| Structure | Primary CTA | Section order | What is cut | Signal metric |
|---|---|---|---|---|
| Self-serve product (free trial or free plan) | Start free | 1 Hero, 5 Product visual, 4 How it works, 2 Proof, 6 Pricing teaser, 8 FAQ, 9 Final CTA | Long testimonials | Signup start rate; activation rate downstream |
| Demo-led B2B | Book a demo | 1 Hero, 2 Proof, 3 Benefits, 7 Testimonials, 5 Visual, 8 FAQ, 9 Final CTA | Pricing teaser (price is discussed in the call) | Demo form completion; qualified share |
| Developer tool | Read the docs or install | 1 Hero with code snippet, 4 How it works (3 commands), 5 Visual or output, 2 Proof, 6 Pricing, 9 CTA | Marketing-style benefits | Docs click rate; first-call success |
The pattern in every row: the section the page's CTA depends on moves up, and the section that does not help that CTA moves out. A self-serve page puts "how it works" early because the visitor must believe they can start in minutes; a demo-led page puts testimonials early because the visitor must trust a vendor before talking to a human.
Where does attention go on a page like this?
Eye-tracking research from Nielsen Norman Group found that people spent 57% of their viewing time above the fold and 74% within the first two screenfuls, with 120 participants and more than 130,000 eye fixations (NN/g, Scrolling and Attention, 2018). Practical result: the hero, the first proof and the first CTA must work within the first two screens.
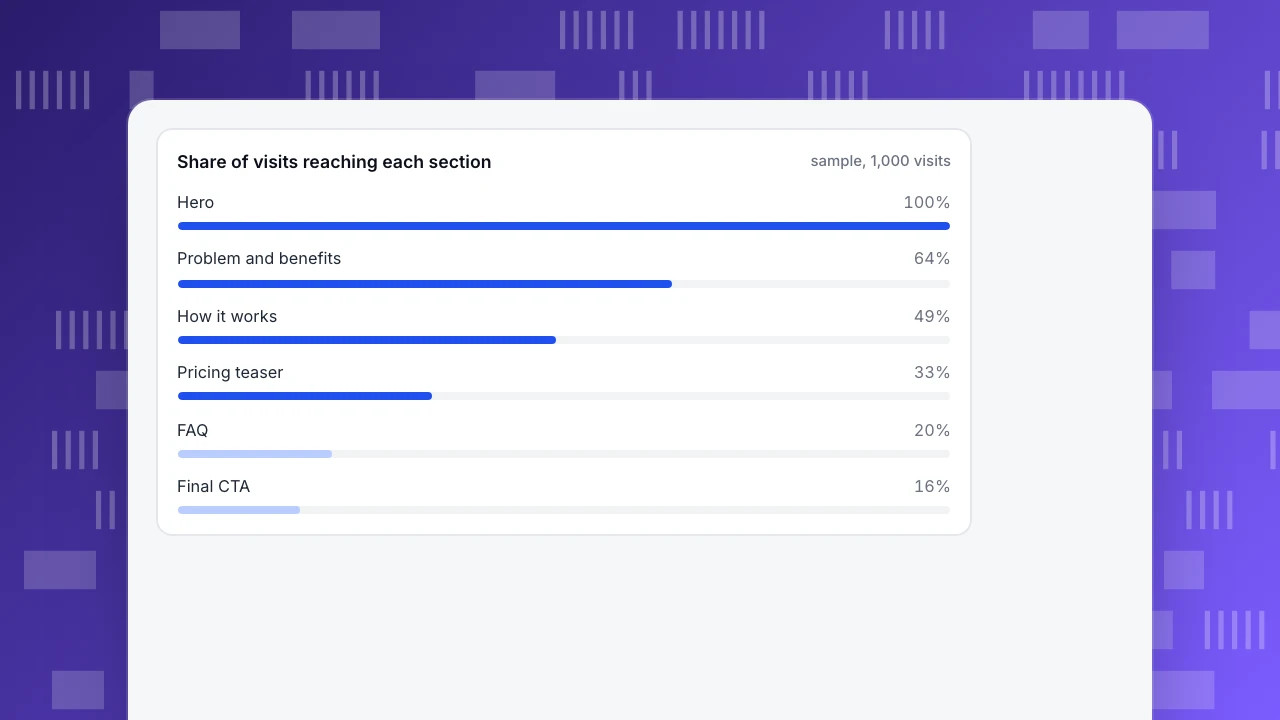
You can see the same pattern in your own scroll data. Sample data for 1,000 visits to a self-serve page:
| Section | Share of visits that reach it | Change from the section above |
|---|---|---|
| Hero | 100% | n/a |
| Social proof strip | 78% | −22% |
| Problem and benefits | 64% | −18% |
| How it works | 49% | −23% |
| Product visual | 41% | −16% |
| Pricing teaser | 33% | −20% |
| Testimonials | 27% | −18% |
| FAQ | 20% | −26% |
| Final CTA | 16% | −20% |
Recompute one row: 49 ÷ 64 = 0.766, a 23% drop from the section above. Two decisions follow from the table. First, a CTA only at the bottom is seen by 16 in 100 visitors, while one in the hero is seen by all 100, so the primary CTA belongs in the hero and is repeated after the benefits (64%). Second, the biggest relative drops are "How it works" (−23%) and FAQ (−26%): shorten them or move the content that matters above the point where reach falls below about half.
Share of visits reaching each section
sample, 1,000 visitsHow do you write a hero that does its job?
A hero answers question 1 with three parts: outcome, audience, how. Three invented examples, rewritten from vague to specific:
| Vague | Specific |
|---|---|
| "The all-in-one platform for modern teams" | "Send invoices in two minutes and get paid faster, built for freelancers" |
| "Supercharge your workflow" | "Turn support emails into tasks automatically, so nothing waits in an inbox" |
| "Analytics reimagined" | "See which pages and sources bring paying customers, in one report" |
The test: cover the logo. Could a stranger say what the product does, for whom, and what they get? If not, rewrite. Pair the headline with one primary action, and a secondary link only if it serves a different visitor (for example "See pricing").
How should you place social proof and pricing?
- Proof goes early and is specific. A strip such as "used by 2,400 small teams" (an invented figure) near the hero answers question 2 before the visitor leaves. Only show logos or quotes you have permission to use, and only claims you can back with a number.
- A testimonial needs a result. "Great product" does nothing; "cut our invoicing time from 3 hours to 40 minutes" does. The result must be real and attributable.
- Show a price signal when price is the real objection. A starting price or a free tier removes the "will this cost too much" exit. Hiding it moves the question to a pricing page click, which you can count.
- Put objections in the FAQ, not in the footer. Use the questions your chat and support already get.
Does page speed belong in a landing page teardown?
Yes, because the hero is usually the heaviest element. In a study of 37 European and American brand sites with more than 30 million user sessions, a 0.1-second mobile load-time improvement went with 8.4% higher retail conversion and 10.1% higher travel conversion (web.dev, Deloitte study). The "good" threshold for Largest Contentful Paint is 2.5 seconds or less at the 75th percentile (web.dev). A full-width hero image or an autoplaying video is the usual cause of a miss, so size and compress it, and check the number on real visitors rather than in a lab test.
How do you measure a landing page once it is live?
Track five things, split by traffic source, because a page that converts organic visitors may fail paid ones:
- Primary CTA clicks per visit, as a rate.
- Scroll reach by section, as in the table above.
- Form starts and form submits, to find the field or step where people leave.
- Conversion by source and campaign, using UTM tags consistently.
- LCP at the 75th percentile, per landing page, on real visits.
Change one thing at a time, annotate the date, and wait for a full week or two so weekday patterns do not fool you. If you make several changes at once you cannot say which one worked.
How do you do this in TapCub?
Start with the scroll table above and apply it to your own page:
- In Web analytics › Sources, check which sources and UTM campaigns send visitors to the page, so you can split every number below by source.
- Turn on autocapture and Scroll depth (plan permitting), then open All-platform analytics › Behavior › Heatmaps. The Scroll reach tab shows the share of visits that reached each depth, which is your version of the table. The Clicks and Elements tabs show where people click, including things that are not links.
- Define the page's goal in Web analytics › Goals (a CTA event, a thank-you page or a signup) and read conversion by source. Track form submissions, which records only the form id, name and action and never what people type.
- Read LCP at P75 for the landing page in Monitoring › Performance.
- Mark each page change in Configuration › Annotations, then compare the periods.
TapCub does not build landing pages or split traffic between versions, so it cannot run an A/B test. It measures what each version did, and you compare periods or run a split in your own tooling.
FAQ
What makes a good SaaS landing page?
A hero that states the outcome, audience and action; early, specific proof; a clear route to the main CTA; and a fast load. Each section should answer one visitor question, and the page should be measured by CTA click rate, scroll reach and conversion by source.
What sections should a SaaS landing page have?
Hero, social proof, problem and benefits, how it works, a product visual, a pricing signal, testimonials, FAQ and a final CTA. Reorder them by what the page asks the visitor to do, and cut the ones that do not help that action.
How long should a SaaS landing page be?
As long as it takes to answer the visitor's questions, but with the essentials in the first two screens: in one eye-tracking study, 74% of viewing time was in the first two screenfuls. Use your own scroll-reach data to decide what to shorten.
Where should the call to action go?
In the hero, and repeated after the benefits and at the end. In the sample above only 16% of visits reach the final section, so a bottom-only CTA misses most visitors.
How do you know which landing page example to copy?
You cannot tell from a list, because examples are chosen on appearance and carry no conversion data. Copy the structure for your goal, then measure it and change one thing at a time.
Sources
- Nielsen Norman Group: Scrolling and Attention, 2018, checked 2026-11-21
- web.dev: Milliseconds make millions (Deloitte study), checked 2026-11-21
- web.dev: Web Vitals, checked 2026-11-21
- Kohavi et al., Online Controlled Experiments at Large Scale (KDD 2013), checked 2026-11-21
Was this article helpful?
We use your answers to fix and expand this page.
Couldn’t send. Please try again in a minute.
Thanks for the feedback. We’ll use it to improve this page.You’ve already sent feedback on this page. Thanks.

Product Experience Specialist
Explores usability, user journeys, and feature adoption through practical examples of onboarding and everyday product use.