Try it on your own data
Every report in this article is in the free plan. One snippet for web and apps, up to 10 sites.
Start freeA SaaS marketing plan built from metrics works backward: 60 new customers at 20% sign-up-to-paid and 4.0% visitor-to-sign-up need 7,500 visitors a month. Derive a CAC ceiling from lifetime value, check every channel against it instead of the blend, and track a few leading and lagging KPIs with written review rules.
What you will learn
- Work backward from customers: 60 customers ÷ 20% ÷ 4.0% = 7,500 visitors a month
- With $49 ARPA, 80% margin and 4% churn, LTV is $980 and the CAC ceiling at 3:1 is $326.67 with an 8.3-month payback
- Check CAC per channel: a blended $155 hid a paid channel at $500 and 12.8 months payback
What is a SaaS marketing plan, and why start from the funnel?
A SaaS marketing plan is a written answer to four questions: how many new paying customers you need, how many visitors that takes, which channels will deliver them and what you can spend per customer. Most plans start from channels ("we will do SEO, ads and email") and end with a budget nobody can connect to revenue. This one starts from the revenue target and works backward through the funnel, so every channel has a number it must hit.
The broader strategy is covered in SaaS marketing and SaaS growth strategy. This article is the planning arithmetic: the numbers that turn a target into a budget and a set of monthly KPIs. The claim is that a plan is only credible if you can run it backward from customers to visitors and forward from spend to payback, and the two ends agree.
You need four inputs from your own data before you start:
| Input | Sample value | Where it comes from |
|---|---|---|
| Average revenue per account (ARPA) per month | $49 | Billing |
| Gross margin | 80% | Finance |
| Monthly churn of paying accounts | 4% | Billing, from cohorts |
| Funnel rates: visitor to sign-up, sign-up to paid | 4.0%, 20% | Analytics |
How do you work backward from the revenue target?
Start from the number of new paying customers you want each month and divide by each funnel rate in turn.
Sample data: the goal is 60 new paying customers a month.
| Step | Calculation | Result |
|---|---|---|
| New paying customers needed | Target | 60 |
| Sign-ups needed | 60 ÷ 20% sign-up-to-paid | 300 |
| Visitors needed | 300 ÷ 4.0% visitor-to-sign-up | 7,500 |
So the plan has to bring 7,500 visitors a month, 300 of whom sign up. If the target moves to 90 customers, the visitor requirement moves to 11,250; if sign-up-to-paid improves from 20% to 25%, the visitor requirement falls to 6,000 for the original goal. That sensitivity is the first use of the model: it shows whether you should spend on more traffic or on improving the funnel, whichever is cheaper per customer.
What can you afford to spend per customer?
The ceiling comes from the value of a customer. Two standard measures, both from your inputs:
Customer lifetime value (gross-margin basis) = ARPA × gross margin ÷ monthly churn
= $49 × 0.80 ÷ 0.04 = $980
CAC ceiling at an LTV:CAC ratio of 3 = $980 ÷ 3 = $326.67
CAC payback in months = CAC ÷ (ARPA × gross margin) = $326.67 ÷ $39.20 = 8.3 months
The 3-to-1 ratio and the 12-month payback are rules of thumb from David Skok's SaaS metrics essay: he writes that the best SaaS businesses have an LTV to CAC ratio higher than 3, that profitability is anemic if the time to recover CAC extends beyond 12 months, and that many of the best recover it in 5 to 7 months. He also stresses they are only guidelines. Use them as guard rails, not targets: a ceiling of $326.67 with a payback of 8.3 months passes both. The CAC, LTV and CAC payback period pages define each term.
How do you allocate the plan across channels?
Give each channel a visitor count, a sign-up rate, a spend and the resulting CAC. Channel definitions should follow your analytics: Google Analytics, for instance, assigns traffic to channel groups such as Organic Search, Paid Search, Referral and Email by rules, and treats visitors who type your address or use a bookmark as Direct.
Sample data: a first draft that reaches the 7,500 visitors. To keep the arithmetic readable, sign-up-to-paid is 20% in every channel, which real channels will not match.
| Channel | Visitors | Sign-up rate | Sign-ups | Customers (20%) | Spend | CAC | Payback (months) |
|---|---|---|---|---|---|---|---|
| Organic search and content | 3,000 | 4.5% | 135 | 27.0 | $3,000 | $111 | 2.8 |
| Paid search | 1,500 | 3.0% | 45 | 9.0 | $4,500 | $500 | 12.8 |
| Partners and referrals | 1,200 | 6.0% | 72 | 14.4 | $1,500 | $104 | 2.7 |
| Email and direct | 1,800 | 3.0% | 54 | 10.8 | $500 | $46 | 1.2 |
| Total | 7,500 | 4.1% | 306 | 61.2 | $9,500 | $155 | 4.0 |
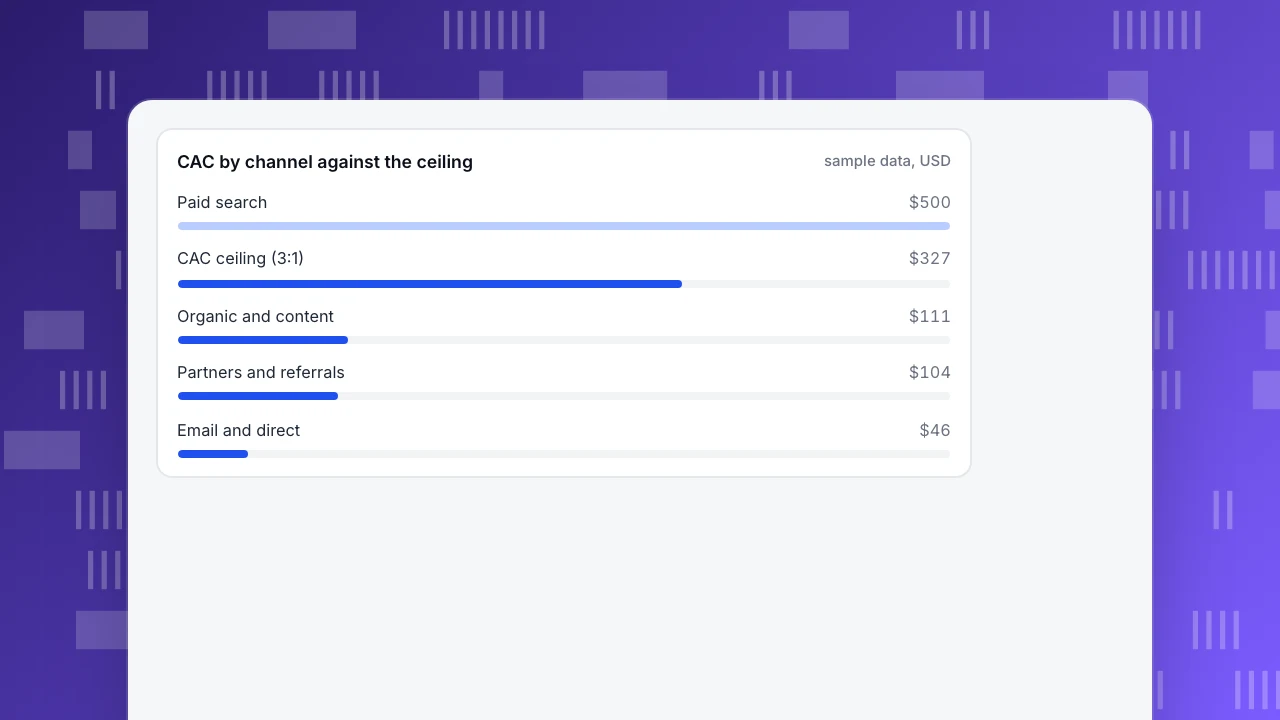
The plan reaches 61.2 customers at a blended CAC of $155, which looks fine against the $326.67 ceiling. The blended number hides the problem: paid search at $500 is above the ceiling and pays back in 12.8 months, past the 12-month guard rail. A plan that only checks the blend would keep funding it.
Apply the ceiling per channel. Move most of the paid budget to the channels under the ceiling, keep a small paid test to learn whether the landing page can lift its sign-up rate, and assume the cheaper channels scale less than linearly.
Sample data: the revised plan.
| Channel | Visitors | Sign-ups | Customers | Spend | CAC |
|---|---|---|---|---|---|
| Organic search and content | 3,800 | 171 | 34.2 | $3,800 | $111 |
| Paid search (test) | 500 | 15 | 3.0 | $1,500 | $500 |
| Partners and referrals | 1,500 | 90 | 18.0 | $1,875 | $104 |
| Email and direct | 1,700 | 51 | 10.2 | $500 | $49 |
| Total | 7,500 | 327 | 65.4 | $7,675 | $117 |
The revision spends $1,825 less and adds 4.2 customers, because it moves visitors from a $500-CAC channel to $104–$111 ones. The figure that deserves suspicion is the assumption that 800 more organic visitors cost $800 more; content scales slowly, so treat it as a target for the quarter, not a promise.
CAC by channel against the ceiling
sample data, USDWhich KPIs should the plan track each month?
Pair each KPI with the number from the model, so a miss points to a channel:
| KPI | Type | Target from the revised plan | If it misses |
|---|---|---|---|
| Visitors by channel | Leading | 7,500 (3,800 / 500 / 1,500 / 1,700) | Check the channel's output first |
| Visitor-to-sign-up rate | Leading | 4.4% (327 ÷ 7,500) | Landing pages and offer |
| Sign-up-to-paid rate | Leading | 20% | Onboarding and trial experience |
| New paying customers | Lagging | 65 | Find which rate above moved |
| CAC by channel | Lagging | Under $326.67 | Cut, or fix the conversion rate |
| CAC payback | Lagging | 12 months or less | Same |
| Monthly churn | Lagging | 4% or lower | Retention, not marketing |
Leading numbers move within weeks and tell you early; lagging ones confirm. Review the leading ones weekly and the lagging ones monthly. Report the rates with their denominators, since a rate with no denominator cannot be compared month to month.
| KPI | Type | Target | If it misses |
|---|---|---|---|
| Visitor-to-sign-up rate | Leading | 4.4% | Landing pages and offer |
| Sign-up-to-paid rate | Leading | 20% | Onboarding and trial experience |
| New paying customers | Lagging | 65 | Find which rate moved |
| CAC by channel | Lagging | Under $326.67 | Cut, or fix the conversion rate |
| CAC payback | Lagging | 12 months or less | Cut, or fix the conversion rate |
Sample data from the revised plan: 7,500 visitors, 327 sign-ups, 65.4 customers, $7,675 spend.
What does the first 90 days look like?
| Weeks | Focus | Exit check |
|---|---|---|
| 1–2 | Measurement: events for sign-up, activation and payment; spend imported by channel; channel rules agreed | Last month's rates can be reproduced from the data |
| 3–6 | Build the three cheapest channels; run the small paid test | Visitor and sign-up targets on track weekly |
| 7–10 | Fix the weakest funnel step before adding spend | Sign-up-to-paid at or above 20% |
| 11–13 | Review CAC and payback by channel; reallocate | Every funded channel under the ceiling or on a written test |
Do not add spend before week 7. More traffic into a funnel that converts at 20% costs the same per customer; a funnel fixed to 25% cuts the visitors needed for 60 customers from 7,500 to 6,000.
When should you change the plan?
Use rules written in advance, so the review is a decision rather than a debate:
- A channel's CAC is above the ceiling for two months in a row: cut its spend by half and test one change to its landing page.
- A channel is under the ceiling by more than half: raise its spend by 25% and watch whether CAC holds; cheap channels often saturate.
- Visitors are on target but sign-ups are not: the offer or landing page is the problem, not traffic.
- Sign-ups are on target but paid conversions are not: look at onboarding and activation before buying more sign-ups.
- Churn rises: the LTV in the model is now too high, so recompute the ceiling before judging channels against it.
How do you track the plan in TapCub?
TapCub measures the funnel, sources and spend; it does not send campaigns, manage a CRM or score leads, so the marketing activity itself lives in your own tools.
- Make sources comparable. In Web analytics › Sources, follow channel and UTM definitions that match your plan, so Organic search, Paid search, Referral and Email in the plan are the same groups you see in the report.
- Track the three events. Set a sign-up goal and a payment event, and build the visitor to sign-up to paid funnel in All-platform analytics › Behavior › Behavior analysis, split by source. This gives the rates for the backward calculation.
- Import spend by channel. In All-platform analytics › Business › Channel ROI, import daily spend by channel, source or campaign as a CSV or entry by entry. TapCub shows cost per click (spend ÷ sessions), cost per acquisition (spend ÷ purchases in orders) and return on ad spend, grouped by channel, source or campaign, which is the CAC column in the table above when your paid conversions are recorded as purchases.
- Compare attribution models side by side. In All-platform analytics › Behavior › Behavior analysis, select first-touch, last-touch, linear, position-based and time-decay together to see a channel that mostly assists, which a last-touch view would underfund.
- Check progress and alert. Use the AARRR page to set annual targets for new users and revenue and read year-to-date progress, and a monitor on sign-ups with a dry run to see how often it would have fired in the past 30 days.
FAQ
What should a SaaS marketing plan include?
A revenue target converted into customers, sign-ups and visitors; a customer value and CAC ceiling; a channel plan with spend and expected CAC; KPIs with targets; a 90-day calendar; and review rules written in advance. Add budget only after the arithmetic works.
How do you build a SaaS marketing plan from funnel metrics?
Divide the new paying customers you want by sign-up-to-paid, then by visitor-to-sign-up, to get the visitors needed. Then compute LTV and a CAC ceiling and allocate visitors to channels so that every channel's CAC stays under the ceiling.
What is a good CAC for SaaS?
It depends on your margins and churn. A common guard rail is an LTV to CAC ratio above 3 and a payback of 12 months or less, as David Skok describes. With $49 ARPA, 80% margin and 4% churn, the ceiling is about $327.
How much should a SaaS company spend on marketing?
Spend whatever keeps every funded channel under the CAC ceiling and the payback within your cash limits. The sample plan reaches 65.4 customers for $7,675 a month, a blended CAC of about $117, but yours depends on your rates.
Sources
- David Skok, SaaS Metrics 2.0 – A Guide to Measuring and Improving What Matters, For Entrepreneurs — the LTV to CAC ratio above 3, the 12-month CAC recovery guideline and the 5 to 7 month examples. Checked 2026-11-21.
- Google Analytics Help, [[GA4] Default channel group](https://support.google.com/analytics/answer/9756891) — the rule-based channel categories and the definition of Direct. Checked 2026-11-21.
Was this article helpful?
We use your answers to fix and expand this page.
Couldn’t send. Please try again in a minute.
Thanks for the feedback. We’ll use it to improve this page.You’ve already sent feedback on this page. Thanks.

Product Experience Specialist
Explores usability, user journeys, and feature adoption through practical examples of onboarding and everyday product use.