Try it on your own data
Every report in this article is in the free plan. One snippet for web and apps, up to 10 sites.
Start freeA SaaS metrics dashboard should be laid out by customer stage: acquire, activate, revenue, retain and efficiency, with three or four numbers per row and a written definition under each. The sample company here shows how an MRR bridge, churn, gross and net retention and CAC payback all reconcile from the same inputs.
What you will learn
- Lay the page out by stage; every tile answers one question someone asks in the weekly review
- Draw an MRR bridge (new, expansion, contraction, churn) instead of one MRR number; in the sample 100,000 becomes 111,000
- Write the retention definition under the tile: GRR is 94.0% and NRR 99.0% from the same bridge, and public filings define net retention three ways
Lay the dashboard out by stage, left to right
A SaaS metrics dashboard should read like the customer's path: acquire, activate, pay, stay. Each stage gets one row of three or four numbers, and every number answers one question someone will ask in the weekly review. If a number does not change a decision, it does not earn a tile.
| Stage | The question it answers | Numbers to show | Where the data usually lives |
|---|---|---|---|
| Acquire | Are the right people arriving? | Visitors by source, signups, signup rate | Web analytics |
| Activate | Do new signups reach the first useful result? | Activation rate, time to activate | Product analytics |
| Revenue | How is recurring revenue moving? | MRR bridge, ARPA | Billing system |
| Retain | Who is leaving and who is growing? | Gross MRR churn, logo churn, GRR, NRR | Billing plus product analytics |
| Efficiency | Is growth paying for itself? | CAC, CAC payback | Finance plus marketing spend |
The last column is the part most dashboards hide. Three different systems own these numbers, and the dashboard works only if each tile says where it comes from and how often it refreshes. The sections below use one sample company so every figure can be recomputed.
| Stage | Question it answers | Numbers to show | Where the data usually lives |
|---|---|---|---|
| Acquire | Are the right people arriving? | Visitors by source, signups, signup rate | Web analytics |
| Activate | Do signups reach a first useful result? | Activation rate, time to activate | Product analytics |
| Revenue | How is recurring revenue moving? | MRR bridge, ARPA | Billing system |
| Retain | Who is leaving and who is growing? | Gross MRR churn, logo churn, GRR, NRR | Billing plus product analytics |
| Efficiency | Is growth paying for itself? | CAC, CAC payback | Finance plus marketing spend |
Each tile should show its data source, definition and refresh time.
Acquire: show sources and signup rate, not total traffic
Total visitors says little about a SaaS business, because most visitors are not buyers. Show visitors split by source, then signups, then the signup rate for each source: signups ÷ visitors.
Sample data: 2,000 signups in the month. A channel that sends 10,000 visitors and 200 signups converts at 2.0%; one that sends 1,000 visitors and 120 signups converts at 12.0%. The second is six times better per visitor even though it sends a tenth of the traffic, and only the per-source rate shows it. Keep bot traffic out of the denominator, or the rate is understated.
Activate: pick one event and one window
Activation is the share of new signups who do the thing that makes the product useful, within a fixed window. Choose one event that your best customers all did early, and one window, such as 7 days, and keep both fixed so the line is comparable across months.
Sample data: 2,000 signups, of whom 640 completed the key setup step within 7 days.
- Activation rate = 640 ÷ 2,000 = 32.0%.
- Of the 2,000 signups, 240 became paying customers: signup-to-paid = 240 ÷ 2,000 = 12.0%.
- Paid share of activated signups, if all payers were activated: 240 ÷ 640 = 37.5%.
The third line is a diagnostic, not a goal. When signup-to-paid moves but activation does not, the change is in pricing or sales; when activation moves first, product onboarding changed. Put the two lines next to each other so the cause is visible.
Revenue: draw the MRR bridge, not one MRR number
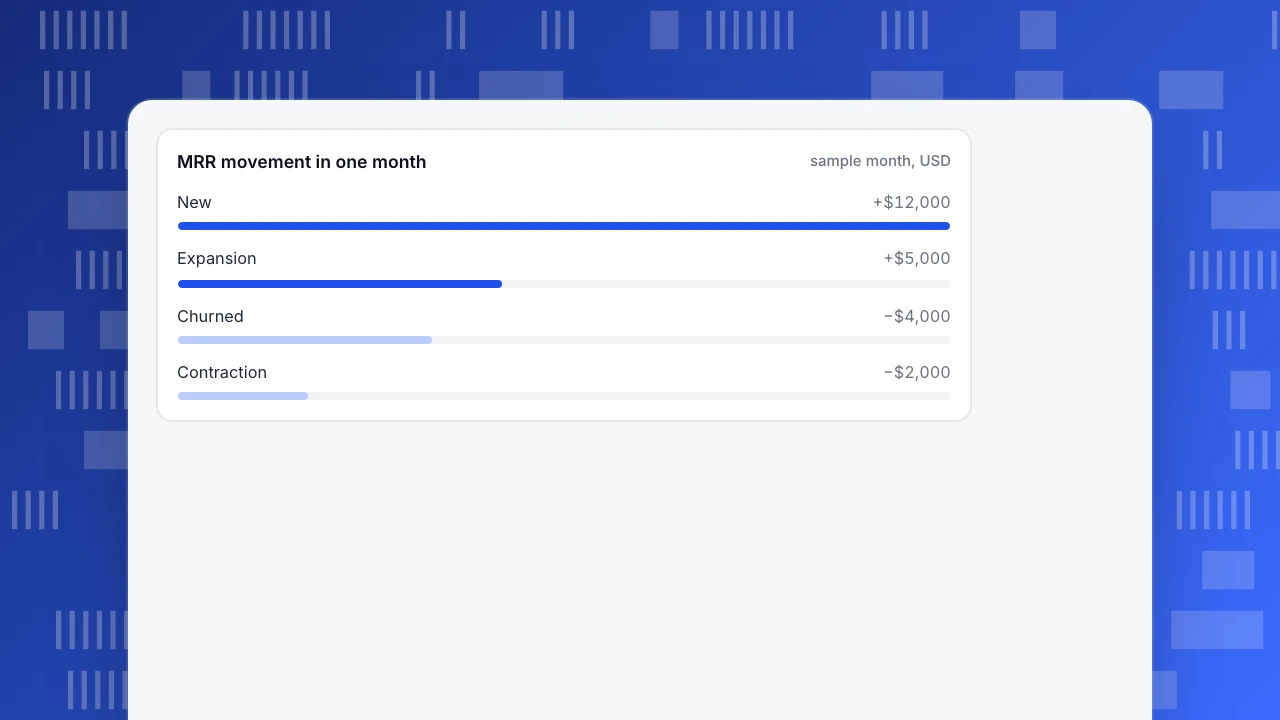
A single MRR figure hides what moved it. A bridge splits the month's change into four parts: new, expansion, contraction and churn.
Sample data, USD:
| Line | Amount | How it is defined |
|---|---|---|
| Starting MRR | 100,000 | Recurring revenue on day 1 |
| New | +12,000 | First-time customers |
| Expansion | +5,000 | Existing customers who paid more |
| Contraction | −2,000 | Existing customers who paid less |
| Churned | −4,000 | Customers who cancelled |
| Ending MRR | 111,000 | 100,000 + 12,000 + 5,000 − 2,000 − 4,000 |
Net new MRR is 111,000 − 100,000 = 11,000. The headline growth is 11.0%, but only 12,000 of it came from new customers, and 6,000 of the base was lost. A related ratio, the quick ratio, divides growth by losses: (12,000 + 5,000) ÷ (2,000 + 4,000) = 2.83. Treat it as a quick read of the bridge, not a standard.
Show ARPA beside the bridge: average revenue per account = MRR ÷ paying accounts. In the sample, 60 new customers brought 12,000 of new MRR, so new-customer ARPA is $200.
MRR movement in one month
sample month, USDRetain: show four retention numbers and label which is which
Retention gets four tiles because each answers a different question. Using the same bridge:
- Gross MRR churn = (contraction + churned) ÷ starting MRR = (2,000 + 4,000) ÷ 100,000 = 6.0%. This is the money lost from the base.
- Gross revenue retention (GRR) = 1 − gross MRR churn = 94.0%. It can never exceed 100%.
- Net revenue retention (NRR) = (starting MRR + expansion − contraction − churned) ÷ starting MRR = (100,000 + 5,000 − 2,000 − 4,000) ÷ 100,000 = 99.0%. Expansion can lift it above 100%.
- Logo churn = customers lost ÷ customers at start = 14 ÷ 400 = 3.5%. A small customer and a large one count the same.
Two cautions. First, a month is a short window: 99.0% monthly NRR compounds to about 88.6% over twelve months (0.99 ^ 12), but a true annual figure follows one cohort for twelve months, so do not simply multiply. Second, public companies define this differently, which is why you must write your definition under the tile. One public cybersecurity company reports a dollar-based net retention rate of 115% as of January 31, 2026, measured on a twelve-month basis and excluding new customers. Another software company's filing defines its denominator as the annual recurring revenue of all active subscriptions on the last day of the same period in the prior fiscal year. A third calculates over four trailing quarters of subscription revenue. All three are "net retention", and none matches a single month.
Add one cohort view under the retention row. The four tiles above summarise a month; a cohort table shows whether newer signups stay longer than older ones. Rows are signup months and columns are months since signup, so a diagonal change shows that onboarding work is paying off, which a single churn number cannot.
Efficiency: CAC and payback in months
Customer acquisition cost (CAC) = sales and marketing spend ÷ new customers. CAC payback in months = CAC ÷ (ARPA × gross margin).
Sample data: $90,000 of sales and marketing spend, 60 new customers, ARPA $200 a month, 80% gross margin.
- CAC = 90,000 ÷ 60 = $1,500.
- Payback = 1,500 ÷ (200 × 0.80) = 9.4 months.
Show payback rather than the LTV-to-CAC ratio on the main dashboard: months to recover the spend is a number a finance partner can check against cash, while lifetime value depends on a churn assumption that moves. Our guide to the LTV to CAC ratio covers the ratio.
What to leave off the main page
A dashboard fails by growing, not by being short. Keep these off the main view and in drill-downs:
- Total pageviews, total signups ever, total users. They only go up.
- More than one retention definition per tile. Pick one and label it; list the alternatives on a definitions page.
- Per-feature usage. Useful for product work but not for the weekly revenue review; link to it.
- Anything with no owner. If nobody will change something when it moves, remove it.
For metrics background see SaaS metrics and the general guide to a metrics dashboard; this article is only about layout and the sample numbers.
In TapCub: the acquire, activate and retain rows
TapCub is not a billing system. It does not read your subscriptions or compute MRR, churn or NRR, and it does not do payments or dunning, so the revenue row stays in your billing tool. TapCub covers the product-side rows: acquisition, activation and usage-based retention. Here is how to build them for the sample company.
- Acquire. Open Web analytics › Sources to see visitors by channel, source and UTM parameter, and Web analytics › Goals to mark the signup page or signup event as a goal. Bots and AI crawlers are counted separately, so they do not inflate the denominator of your signup rate.
- Activate. In All-platform analytics › Behavior › Behavior analysis, build a funnel from the signup event to the key setup event. A funnel takes 2 to 20 steps and a conversion window of up to 180 days, so a 7-day window is one setting. The result shows the count at each step and the median time from the previous step, which is your time to activate.
- Retain by usage. In the same place, run Retention with signup as the start event and the key action as the return event. Use Segments & tags under All-platform analytics › Users to group people who did or did not activate, and compare them.
- Accounts. For a B2B product, call
tapcub.group('company', 'acme', {...})after login. All-platform analytics › Users › Accounts then shows active accounts and a health score from 0 to 100 built from recent activity. - Alert on the numbers. Use All-platform analytics › Operations › Monitors to watch a saved metric, such as signups, and get notified by email or Webhook when it drops. Monitors only notify; they do not act.
Revenue can be added as a property on a goal event and summed in the goal reports, but that is a convenience for web revenue, not a replacement for your billing system's MRR.
FAQ
What should be on a SaaS metrics dashboard?
Five rows in stage order: acquisition (visitors by source, signup rate), activation (activation rate), revenue (MRR bridge, ARPA), retention (gross churn, GRR, NRR, logo churn) and efficiency (CAC payback). Each tile should say where its data comes from and which definition it uses.
How many metrics should a SaaS dashboard have?
Fewer than 20 on the main page, usually three or four per stage. If a number cannot change a decision in the weekly review, move it to a drill-down. A dashboard that keeps growing stops being read.
What is the difference between GRR and NRR?
Gross revenue retention counts only losses from existing customers, contraction and churn, so it can never pass 100%. Net revenue retention also adds expansion. In the sample, GRR is 94.0% and NRR is 99.0%. A company with NRR above 100% grows from its base even if it adds no new customers.
How often should the dashboard refresh?
Match the source. Web and product metrics can refresh daily or hourly; billing metrics usually refresh when invoices post. Put the refresh time on each tile so nobody compares a live number with a month-end one.
Can I build a SaaS metrics dashboard in TapCub?
Partly. TapCub covers acquisition, activation, usage retention and account health. It does not compute MRR, churn or NRR, because it does not read your billing system. Pair it with your billing tool for the revenue row.
Sources
- CrowdStrike Holdings, Form 10-K for the fiscal year ended January 31, 2026: a 115% dollar-based net retention rate as of January 31, 2026. Checked 2026-11-21.
- Zscaler, Form 10-K for the fiscal year ended July 31, 2025: definition of dollar-based net retention rate. Checked 2026-11-21.
- Pluralsight, Form 10-K for 2020: net retention on a trailing four-quarter basis. Checked 2026-11-21.
Was this article helpful?
We use your answers to fix and expand this page.
Couldn’t send. Please try again in a minute.
Thanks for the feedback. We’ll use it to improve this page.You’ve already sent feedback on this page. Thanks.

Data Analyst
Explores traffic sources, conversion funnels, and retention, using clear metric definitions and concrete examples to explain what the numbers mean.