Try it on your own data
Every report in this article is in the free plan. One snippet for web and apps, up to 10 sites.
Start freeSaaS onboarding exists to get new sign-ups to activation, the first moment they get real value, as fast as possible. Choose the activation event by comparing paid rates, then fix the step where most users stop: in our sample the biggest drop is 224 of 640 users before the first event, and lifting that step from 65% to 75% adds about 38 activated users.
What you will learn
- Pick the activation event from data: in the sample, users who sent a first event paid at 13.2% against 0.9% for those who did not
- Find the biggest drop in absolute users (224 at the first-event step), and estimate a fix in users before you build it
- Report by weekly sign-up cohort, and compare benchmarks (median free-to-paid 8%) only as a range
What SaaS onboarding is for: getting a new user to activation
SaaS onboarding is everything between sign-up and the moment a new user first gets the value they came for. That moment is called activation. If onboarding has a single job, it is to get as many new sign-ups as possible to activation, quickly. Welcome emails, checklists and tours are tools for that job, and a tool is only worth keeping if the activation number moves.
This is why the first task is not designing screens. It is deciding what activation means for your product, measuring how many users reach it, and finding the step where most of them stop. The rest of this article does that with one worked example. For the wider topic, see user onboarding and onboarding metrics.
Define the activation event with your own data
Activation is a behavior that predicts that someone will stay or pay. Pick it by comparing candidate events, not by guessing.
Sample data: 1,000 sign-ups over a month, and 60 of them (6.0%) paid within 30 days. For each candidate event, compare the paid rate of users who did it within 7 days of sign-up with those who did not.
| Candidate event (within 7 days) | Users who did it | Paid rate if done | Paid rate if not done | Ratio |
|---|---|---|---|---|
| Verified email | 820 (82%) | 7.1% | 1.1% | 6.4× |
| Created a project | 640 (64%) | 8.9% | 0.8% | 10.7× |
| Sent a first event | 416 (42%) | 13.2% | 0.9% | 15.4× |
| Saw the first report after that event | 250 (25%) | 19.2% | 1.6% | 12.0× |
The paid users add up in every row (for example, 58 + 2 = 60 for email verification). Read the table like this:
- The ratio rises as the event gets closer to real use and stops rising at the last step. Pick the event where the ratio peaks or plateaus: here "sent a first event".
- An event that more than about 20% of sign-ups can reach is a better target than one almost nobody reaches.
- This shows association, not cause. People who were going to pay anyway are more likely to do everything. To test cause, change the flow and compare, which is a job for an experiment.
For the rest of this article, activated = reached the last step in the table: sent a first event and saw the first report within 7 days.
| Candidate event (7 days) | Users who did it | Paid if done | Paid if not done |
|---|---|---|---|
| Verified email | 820 (82%) | 7.1% | 1.1% |
| Created a project | 640 (64%) | 8.9% | 0.8% |
| Sent a first event | 416 (42%) | 13.2% | 0.9% |
| Saw the first report after that | 250 (25%) | 19.2% | 1.6% |
Sample data: 1,000 sign-ups, 60 paid within 30 days; shows association, not cause.
The activation funnel: where users stop
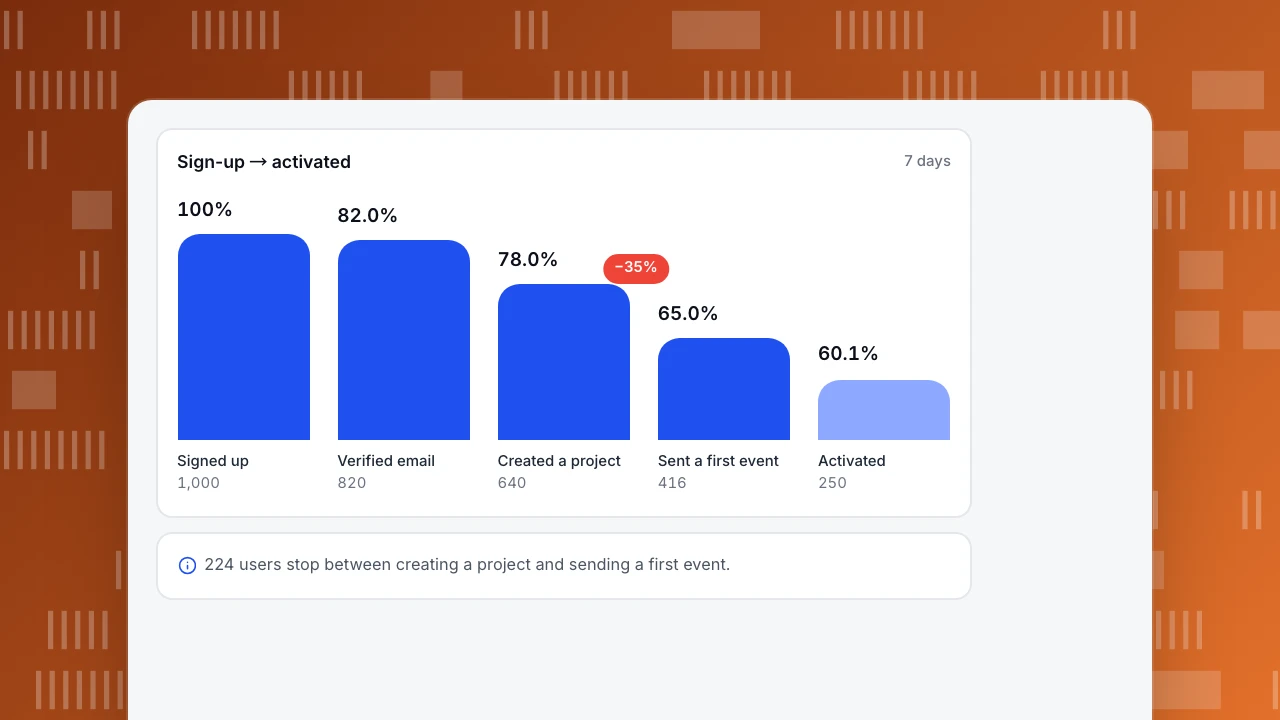
Sample data: the same 1,000 sign-ups through the five steps.
| Step | Users | Of previous step | Of sign-ups | Lost at this step |
|---|---|---|---|---|
| Signed up | 1,000 | 100% | ||
| Verified email | 820 | 82.0% | 82.0% | 180 |
| Created a project | 640 | 78.0% | 64.0% | 180 |
| Sent a first event | 416 | 65.0% | 41.6% | 224 |
| Saw the first report (activated) | 250 | 60.1% | 25.0% | 166 |
The biggest drop in absolute terms is between "created a project" and "sent a first event": 224 users, a step conversion of 65.0%. That step is where users must do something outside the product (install a snippet or connect a source), so it is also the one most likely to need help.
Estimate a fix in users before you commit to building it. If a better install guide lifts that step from 65% to 75%, then 640 × 0.75 = 480 users reach it instead of 416. At the 60.1% conversion to the next step that is 288 activated instead of 250, about 38 more. With a 19.2% paid rate among activated users, that is roughly 7 extra payers a month, taking 60 to about 67 (6.0% to 6.7%).
Sign-up → activated
7 daysSigned up
1,000
Verified email
820
Created a project
640
Sent a first event
416
Activated
250
What to put in the onboarding flow
Design the flow backwards from the activation event. Count the steps a user must take to reach it, and remove or defer anything that is not on that path.
- Ask for the minimum at sign-up. Every extra field costs sign-ups. Collect the rest later, in context.
- Make the first useful action obvious. One primary button on the first screen, named for the outcome ("Add your site"), not for the feature.
- Show help when the user needs it. The Nielsen Norman Group found that tutorials and launch-time walkthroughs interrupt people and are easily forgotten, while help triggered by what the user is doing, such as tooltips and step-by-step wizards, avoids those problems. Use it at the step where the drop happens.
- Keep a way back to the help. Users should be able to reopen a tip or checklist later.
- Give a person a way in. A short message or chat on the step with the biggest drop catches people who are stuck.
The numbers to track
| Metric | Definition | Sample value |
|---|---|---|
| Activation rate | Users who reach the activation event within 7 days ÷ sign-ups | 25.0% (250 ÷ 1,000) |
| Step conversion | Users at a step ÷ users at the previous step | 65.0% at "sent a first event" |
| Time to activate | Median time from sign-up to the activation event | Measure it; shorter is better |
| Week-1 retention | Activated users still active in days 7 to 13 ÷ activated users | Track by cohort |
| Trial-to-paid | Paid within the window ÷ sign-ups | 6.0% (60 ÷ 1,000) |
| Paid rate by activation | Paid rate of activated vs not activated | 19.2% vs 1.6% |
Report them by weekly sign-up cohort, so a change in the flow shows up as a change in a cohort and not as noise in an all-time average.
Sample data: cohort A activated 250 of 1,000 (25.0%). Cohort B, after a shorter install guide, activated 290 of 1,000 (29.0%). The gap is 4.0 points, and the standard error of the difference is 2.0 points, so the gap is about two standard errors wide: suggestive, not settled. Wait for a second cohort before you call the guide a success.
How to read a benchmark honestly
ChartMogul's SaaS Conversion Report (February 2026), which looked at 200 B2B software products surveyed in January 2026, reports a median free-to-paid conversion of 8%. It also reports that the most common free trial is 14 days (62% of products), and that trials requiring a credit card convert at 30%, more than 5 times the rate of those that do not; 20% of the products require a card.
Our sample's 6.0% sits under that 8% median, but the comparison is not clean: the report covers many kinds of products, trial lengths and sales models, and your definition of "paid" may differ. Use a benchmark to see whether you are in a plausible range, and then compare against your own previous cohort. If your rate is below the median, do not copy someone else's flow; find your biggest drop in the funnel above.
Fixing the biggest drop
Use these rules, matched to what the funnel shows:
- If many users stop before verifying email, the email is not arriving or is hard to find. Check delivery and show a "resend" link on the waiting screen.
- If users stop before creating a project, the first screen asks for too much or the value is unclear. Cut fields and show a finished example.
- If users stop before the first event, the setup is the barrier: shorten it, give copy-and-paste steps, and offer help on that screen. This is the case in the sample.
- If users stop after the first event and before the first report, the product is not showing results soon enough. Show data as soon as it arrives.
- If activated users still do not pay, onboarding is done and the problem is the offer or the price.
Change one step at a time, measure the next cohort and compare with the previous one. If you change three things at once you cannot tell which one worked.
Measuring onboarding in TapCub
TapCub measures onboarding; it does not build in-app checklists, tours or emails. Your product team builds those, and TapCub shows whether they work.
- Write the onboarding events (signed up, verified, project created, first event sent, first report seen) in All-platform analytics › Data › Tracking plan, with owners and status. Use Live verification (24 h) to see each event's hits and the completeness of its required properties before you trust the funnel.
- Identify users with
tapcub.loginafter sign-up so that a person's pre-sign-up visit and later actions join one profile in All-platform analytics › Users › People. - In All-platform analytics › Behavior › Behavior analysis, build a funnel with the five steps and a 7-day window. Each step shows count, rate against step one, rate against the previous step, drop-off and median time from the previous step, and the largest drop is marked. Click a step to see the people who dropped there.
- Save the activated users as a segment in All-platform analytics › Users › Segments & tags and use it as a group in retention to see whether activated users come back.
- For why users stop at a step, open Session replay (off by default) on that page. For stuck users on a setup page, add an invite in Live chat › Chat settings › Proactive invites after a delay you choose.
FAQ
What is SaaS onboarding?
It is the process that takes a new user from sign-up to first value, called activation. It includes the sign-up flow, setup steps, checklists, emails and help, and is judged by how many users reach the activation event.
What should a SaaS onboarding flow include?
Only the steps on the path to the activation event: minimum sign-up fields, one obvious first action, contextual help where users drop, and a way to reach a person. Remove anything else.
How do I find my activation event?
Compare the paid or retained rate of users who did each candidate event within a window against those who did not. Choose the event where the ratio peaks and that enough users can reach.
What is a good SaaS activation rate?
It depends on how you define activation, so compare with your own earlier cohorts first. In our sample 25.0% of sign-ups activated; a published figure for a different definition is not comparable.
What is a good free-to-paid conversion rate?
ChartMogul's February 2026 report of 200 B2B products found a median of 8%, with 30% for trials that require a credit card. Treat that as a range, not a target.
Sources
- Nielsen Norman Group. Onboarding Tutorials vs. Contextual Help: tutorials and launch-time walkthroughs interrupt users and are forgotten; help triggered by user activity avoids these problems. Checked 2026-11-21.
- ChartMogul. The Conversion Report (February 2026): 200 B2B products; median free-to-paid conversion 8%; 14-day trials in 62% of products; trials requiring a card convert at 30%. Checked 2026-11-21.
Was this article helpful?
We use your answers to fix and expand this page.
Couldn’t send. Please try again in a minute.
Thanks for the feedback. We’ll use it to improve this page.You’ve already sent feedback on this page. Thanks.

Product Experience Specialist
Writes about product experience, practical workflows, and growth, turning complex processes into clear steps for everyday decisions.