Try it on your own data
Every report in this article is in the free plan. One snippet for web and apps, up to 10 sites.
Start freeTo launch a SaaS product, write the goal as one number, back-solve the traffic from your funnel, then give each checklist item a pass condition you can read afterwards. In the sample, 30 paying customers at 0.30% visit-to-paid needs 10,000 visits, and the community post that brought 62.5% of visits produced only 16.0% of activated users.
What you will learn
- Back-solve traffic: goal ÷ visit-to-paid rate (30 ÷ 0.003 = 10,000 visits)
- Read launch week by source: visits and activated users rank sources differently
- Judge the launch by week 2 return and paying customers, not by day-one traffic
Start from a number, not a date
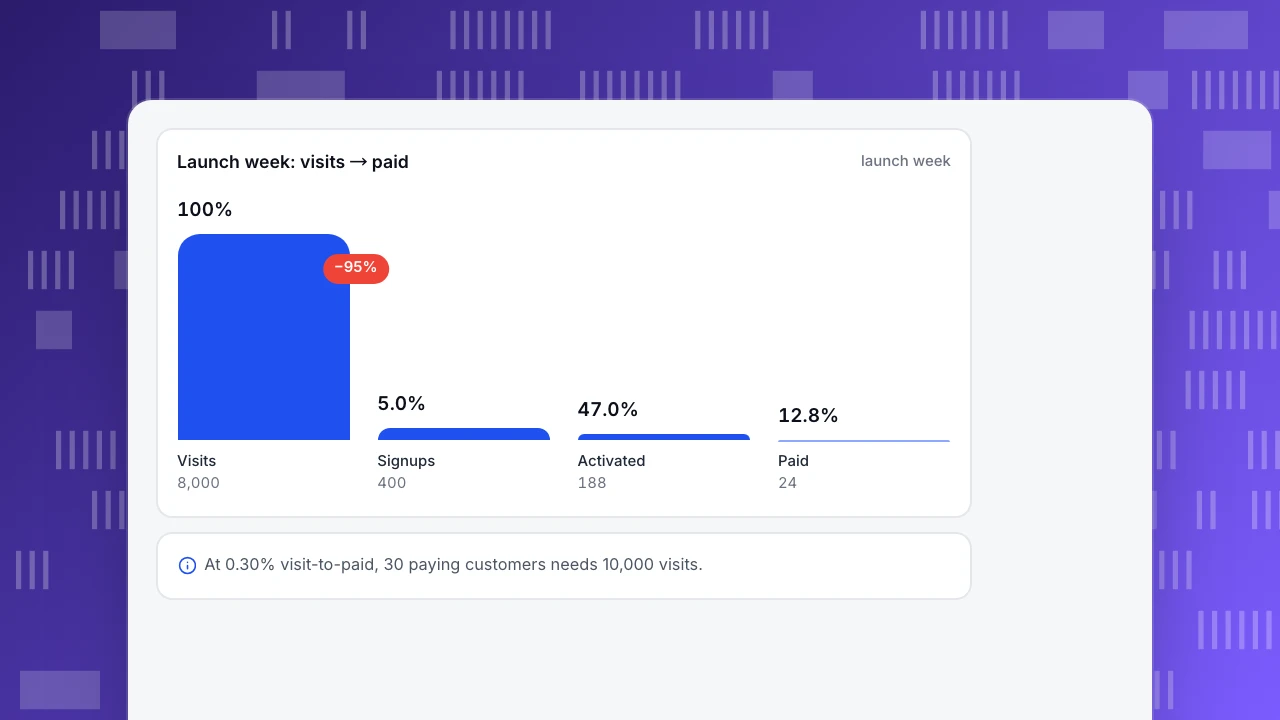
A SaaS launch checklist is only useful if each item ties to a number you can read afterwards. Start by writing the launch goal as one figure and then work backwards through the funnel to see how much traffic you need. Sample data from a launch week: 8,000 visits, 400 signups, 188 activated users (people who reached the first useful action) and 24 paying customers.
- Visit → signup: 400 ÷ 8,000 = 5.0%
- Signup → activated: 188 ÷ 400 = 47.0%
- Activated → paid: 24 ÷ 188 = 12.8%
- Visit → paid: 24 ÷ 8,000 = 0.30%
Now suppose the goal had been 30 paying customers. At 0.30% visit-to-paid, you need 30 ÷ 0.003 = 10,000 visits. That is the planning step most checklists skip. If you can only bring 5,000 visits, you need to raise one of the three step rates before launch, not hope for more traffic on the day. The wider plan is covered in product launch plan, and positioning in SaaS product marketing; this article is the measurement layer.
Launch week: visits → paid
launch weekVisits
8,000
Signups
400
Activated
188
Paid
24
Before launch: seven checks, each with a pass condition
| Check | How to test | Pass if |
|---|---|---|
| 1. Tracking works end to end | Create a test account and watch signup, activation and payment events arrive | All three events seen within a minute |
| 2. Every link is tagged | Open each planned post, email and ad link | Each has a source and campaign tag |
| 3. Pages are fast | Check largest contentful paint on the landing and signup pages | 2.5 seconds or less at the 75th percentile |
| 4. Signup flow is usable | Watch 5 people try it without help | The same blocker appears for fewer than 2 of 5, or is fixed |
| 5. Activation is defined | Write the one action that means "got value" | One event name and one number agreed |
| 6. Help is ready | Answers to the 10 likely questions written, chat on | Someone owns replies on launch day |
| 7. A baseline exists | Record a normal week before launch | Visits, signups and rate saved |
Two of these have outside evidence behind the numbers. Google's guidance for Core Web Vitals sets a good largest-contentful-paint at 2.5 seconds or less, measured at the 75th percentile. And Nielsen Norman Group's model says five test users find about 85% of the usability problems that a given user type can reveal, from 1 − (1 − 0.31)^5 = 84.4% using their typical problem-discovery rate of 31%. Five is enough to catch the big blockers; it is not enough to prove a rate.
Why speed matters here: a study commissioned by Google and run with Deloitte across 37 brand sites and over 30 million sessions found that a 0.1-second improvement in mobile site speed was associated with 8.4% more retail conversions. Treat it as a retail finding, not a promise for your product, but it is a reason not to launch on a slow page.
During launch week: read the funnel by source, not in total
The total hides the difference between traffic sources. Sample data, same launch week:
| Source | Visits | Signups | Signup rate | Activated | Activation rate | Share of activated |
|---|---|---|---|---|---|---|
| Community post | 5,000 | 120 | 2.4% | 30 | 25.0% | 16.0% |
| Email list | 1,200 | 150 | 12.5% | 90 | 60.0% | 47.9% |
| Social | 1,000 | 50 | 5.0% | 20 | 40.0% | 10.6% |
| Search and other | 800 | 80 | 10.0% | 48 | 60.0% | 25.5% |
| Total | 8,000 | 400 | 5.0% | 188 | 47.0% | 100% |
The community post brings 62.5% of the visits and 16.0% of the activated users. The email list brings 15.0% of the visits and 47.9% of the activated users. Which launch effort you repeat should follow the last column, not the first. Check these daily at the same hour for seven days:
- Visits by source against the traffic you planned.
- Signup rate by source: a sudden drop on one source usually means a broken link or form.
- Activation rate: if signups rise and activation falls, the new traffic is the wrong audience or onboarding is failing.
- Errors on signup and payment pages: any rise is more urgent than any conversion number.
- Questions asked in chat: the same question three times means a missing line on the page.
| Source | Share of visits | Share of activated users |
|---|---|---|
| Community post | 62.5% | 16.0% |
| Email list | 15.0% | 47.9% |
| Social | 12.5% | 10.6% |
| Search and other | 10.0% | 25.5% |
Sample data: launch week, 8,000 visits, 188 activated users.
Set tripwires before launch day, not during it
On launch day you will be tired and tempted to explain away bad numbers. Write the action thresholds beforehand, based on the baseline week and the goal. Sample thresholds for the funnel above:
| Signal | Normal | Tripwire | Action |
|---|---|---|---|
| Signup rate on a source | 5.0% overall | Under 2.5% for two hours with 200+ visits | Check the link, the form and the page speed first |
| Activation rate | 47.0% | Under 35% across the day | Read the onboarding steps; look at where new users stop |
| Errors on signup or payment page | Near zero | Any rise above double the baseline | Stop promoting until fixed |
| Chat questions | A few different ones | The same question three times in an hour | Add the answer to the page and the knowledge base |
| Visits from the biggest source | As planned | Under half of plan by midday | Re-send or re-post; do not wait until evening |
The two-hour and 200-visit conditions matter: at 5.0% a 100-visit hour gives 5 signups with a rough 95% margin of ±4.3 points (1.96 × √(0.05 × 0.95 ÷ 100)), so a 2% hour on 100 visits is still inside the noise. Decide on rules that include a minimum sample, or you will chase random swings.
One more rule for the plan: write down which source you expect to be the best and which the worst before launch. If the prediction is wrong, that is the most useful lesson of the week, because it shows where your picture of the audience is off. Keep the prediction in the same document as the tripwires so nobody edits it afterwards.
A one-day runbook
A short schedule keeps the launch day from turning into constant refreshing:
- Two hours before: run the test account again (signup, activation, payment), confirm tagged links are live and chat is on.
- Launch hour: post everything, then check visits by source after 30 minutes. If a source shows zero visits, the link is broken.
- Every two hours: read the tripwire table, note the numbers in a shared doc with the time, and answer chat questions.
- End of day: record visits, signups, activated users and paying customers by source, and write the one thing you would change tomorrow.
- Next morning: compare with the plan and decide whether to re-send, repost or hold.
Treat the day-one numbers as a first read. Signups from an email sent in the evening arrive for several days, and activation needs time, so the first honest funnel is the one you read at the end of week one.
After launch: weeks 2 to 4
Launch spikes fade, so judge the launch by what stays. Sample data: of the 188 activated users, 94 came back in week 2, which is 50.0%; the 24 paying customers came from 188 activated users and 12.8% convert. Three checks after the first week:
- Return rate of activated users in week 2. Compare it across sources: if the community cohort returns at 20% and the email cohort at 70%, the email audience is the product's real fit.
- Time from signup to first value. The median for fast cohorts shows what onboarding can achieve; the slow ones show where to add help.
- Cost per paying customer by source. If you spent 1,200 on a sponsored post that brought 4 paying customers, that is 300 each; compare it with the cost per customer of your email list, which had no extra spend.
Write one page after week 4 with the four funnel rates, the best source by activated users and the first change to make. That page is the input to the next launch.
How to do it in TapCub
Use the launch week above and set up TapCub before the day:
- Install the script and set goals. Add the script, then mark signup, activation and payment as goals in Web analytics › Goals so the funnel has three real events.
- Tag every link. Use UTM parameters on each post, email and ad; Web analytics › Sources then shows visitors by channel, source and campaign.
- Build the funnel. In All-platform analytics › Behavior › Behavior analysis create visit → signup → activated → paid, and break it down by source to get the table above.
- Mark the day. Add a note in Configuration › Annotations for the launch so later charts show it.
- Be ready to answer. Turn on chat in Live chat › Chat settings › Appearance, write the ten likely answers in Live chat › Knowledge base, and set Live chat › Canned replies for the usual follow-ups. Live chat › Reports › Conversion attribution later compares people who chatted with people who only browsed.
- Get alerts. A monitor in All-platform analytics › Operations › Monitors can notify you on error_rate or sessions; it only notifies.
If you spend money on launch promotion, import the cost in All-platform analytics › Business › Channel ROI to see cost per click and cost per customer. TapCub does not run the campaigns, send the emails or A/B test the page; it measures what comes back.
FAQ
What is the first thing to do when launching a SaaS product?
Write the goal as one number, then back-solve traffic through your funnel. In the sample, 30 paying customers at 0.30% visit-to-paid needs 10,000 visits.
What should a SaaS launch checklist include?
Working tracking, tagged links, fast pages, a tested signup flow, a defined activation event, help ready and a baseline week. Each should have a pass condition.
What metrics should I track during a SaaS launch?
Visits, signup rate and activation rate by source, errors on signup and payment pages, and questions asked in chat. Read them daily at the same hour.
How many users do I need to test the signup flow before launch?
Five users per type of user catches most of the big blockers. The Nielsen Norman Group model puts that at about 85% of problems; it will not prove a conversion rate.
How do I know the launch worked?
Judge it by what stays after the spike: activated users returning in week 2 and paying customers by source, not by day-one traffic.
Sources
- Google, web.dev: Largest Contentful Paint (LCP) (2.5 s and 4 s thresholds at the 75th percentile).
- Jakob Nielsen, Why You Only Need to Test with 5 Users, Nielsen Norman Group, 18 March 2000.
- Google and Deloitte, Milliseconds make millions (37 brand sites, over 30 million sessions, +8.4% retail conversions per 0.1 s).
Was this article helpful?
We use your answers to fix and expand this page.
Couldn’t send. Please try again in a minute.
Thanks for the feedback. We’ll use it to improve this page.You’ve already sent feedback on this page. Thanks.

Product Analyst
Focuses on event analysis, conversion funnels, and retention, using clear metric definitions and structured analysis to explain product performance.