Try it on your own data
Every report in this article is in the free plan. One snippet for web and apps, up to 10 sites.
Start freeA SaaS product tour should have three to five steps: in Produktly's 2026 data, median completion was 73% at one or two steps, 38% at three to five, 25% at six to eight and 8% at nine or more. But in a worked six-step funnel, 57% of all losses happen at step 1, so fix the trigger and the first screen before cutting later steps.
What you will learn
- Completion falls with length (73%, 38%, 25%, 8% by step band) and is far higher for user-initiated tours (69%) than auto-started ones (23%)
- Most users are lost at step 1 (380 of 663 in the sample): improving it from 62% to 75% lifts completion to 40.8%, nearly as much as cutting two steps
- Completion is not success: compare activation with a hold-out, because completers were already more motivated
What a SaaS product tour is for
A SaaS product tour is a short guided sequence inside the product that walks a new user to a first useful action. Its job is not to show every feature; it is to get the user to the moment where the product has done something for them, often called activation. A tour that is completed but leads nowhere has failed, however good its completion rate looks.
Three numbers describe a tour: how many people start it, how many reach the end, and how many then do the thing it was meant to lead to. Most published advice discusses the second. This article puts step count and completion first because that is the choice designers make most often and justify least, then connects completion to activation. For the term itself see product tour; for the wider flow, see user onboarding.
What completion benchmarks say about step count
Two published datasets give numbers, both from vendors that measure their own customers, so treat them as directional.
Produktly's benchmark of January to June 2026 data (page last updated 13 August 2026) covers 256 tours; the overall median completion across 88 companies with at least 100 tour starts was 29%. Median completion by tour length:
| Steps | Median completion | Tours in sample |
|---|---|---|
| 1–2 | 73% | 45 |
| 3–5 | 38% | 65 |
| 6–8 | 25% | 84 |
| 9 or more | 8% | 62 |
Produktly also splits by how the tour started: user-initiated tours (90% or more manual starts) had a median completion of 69%, mixed 32%, and auto-started tours (90% or more auto starts) 23%. It presents these as correlations: auto-started tours reach every new user, which lowers completion by design.
Chameleon's 2024 benchmark report, based on 2023 data, reports an average completion of 33.5% across all tours, notes that tours with more than four steps complete below average with five-step tours at 21.6%, and that tours users chose to launch from a checklist completed at 64%.
The two datasets agree on the shape: completion falls as steps are added, and a tour a user chooses to open completes far more often than one pushed at them. They do not agree on exact values, because the samples and definitions differ.
| Steps | Median completion | Tours in sample |
|---|---|---|
| 1–2 | 73% | 45 |
| 3–5 | 38% | 65 |
| 6–8 | 25% | 84 |
| 9 or more | 8% | 62 |
Source: Produktly benchmark, January–June 2026 data (256 tours), updated 13 August 2026.
Why completion falls: the first step does most of the damage
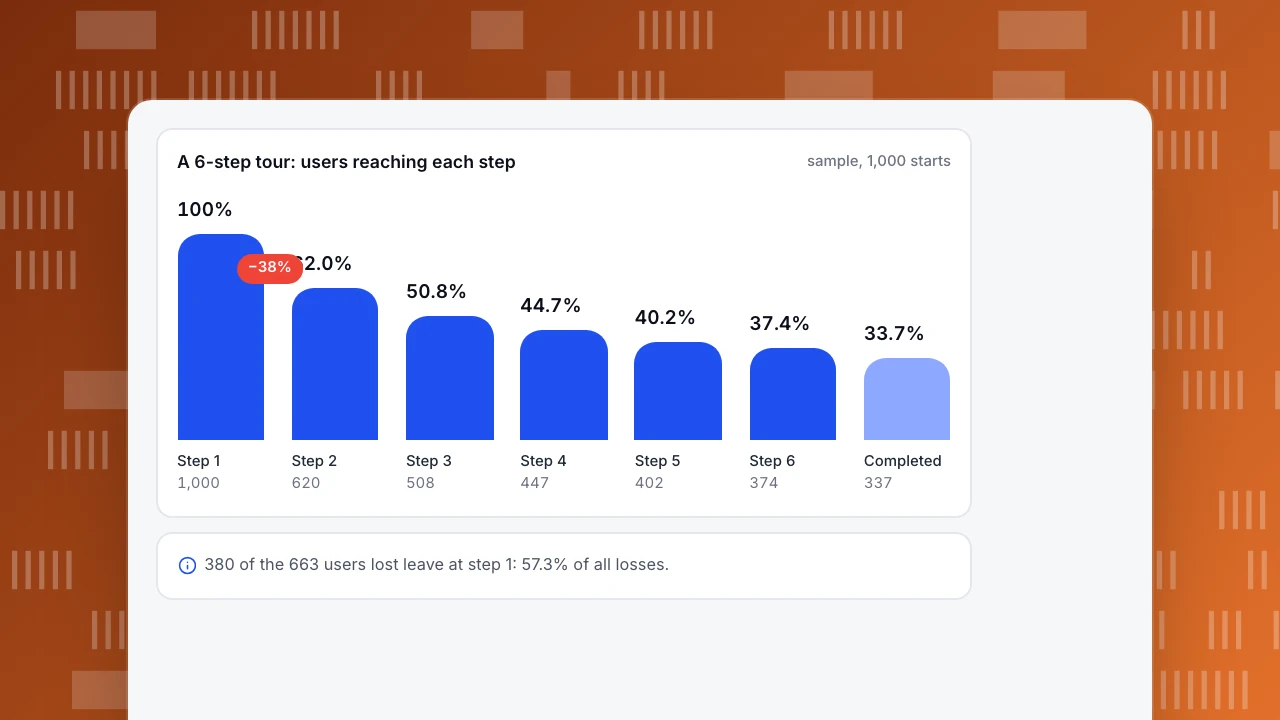
The headline relation hides where people leave. Sample data: a 6-step tour is shown to 1,000 new users.
| Step | Users reaching it | Continue rate to next | Lost at this step |
|---|---|---|---|
| 1 | 1,000 | 62% | 380 |
| 2 | 620 | 82% | 112 |
| 3 | 508 | 88% | 61 |
| 4 | 447 | 90% | 45 |
| 5 | 402 | 93% | 28 |
| 6 | 374 | 90% (clicks Done) | 37 |
| Completed | 337 |
Overall completion is 337 ÷ 1,000 = 33.7%, which is also the product of the continue rates: 0.62 × 0.82 × 0.88 × 0.90 × 0.93 × 0.90 = 0.337. Of the 663 users lost, 380 left at step 1: 57.3% of all losses. The next step accounts for 16.9% and the last four steps for 25.8% together.
The lesson is that continue rates rise as users go on: people who survive the first screen are committed. So cutting the tour from six steps to four would help less than it seems, and fixing the first step or the way the tour is triggered would help more.
A 6-step tour: users reaching each step
sample, 1,000 startsStep 1
1,000
Step 2
620
Step 3
508
Step 4
447
Step 5
402
Step 6
374
Completed
337
Cutting steps: what you might gain
To estimate the gain from cutting steps, multiply the continue rates that remain. If you remove steps 3 and 5 and their drop-offs (the 88% and 93% transitions) disappear while the rest stays unchanged, completion becomes 0.62 × 0.82 × 0.90 × 0.90 = 41.2%, up from 33.7%. That is a gain of 7.5 points, from two removed steps. It is an upper bound, because the information in the removed steps has to go somewhere else, and users who skip them may then fail the first action.
A better use of the arithmetic is to rank candidate improvements: a lift in step 1 from 62% to 75% gives 0.75 × 0.82 × 0.88 × 0.90 × 0.93 × 0.90 = 40.8%, almost as much as cutting two steps and without losing content.
Trigger matters as much as length
Auto-start shows the tour to everyone at the wrong moment for many; user-initiated start shows it to those who asked. Produktly's 69% against 23% gap and Chameleon's 64% for checklist-launched tours point the same way. Practical options:
- Start on demand. A "Show me around" button or a checklist item.
- Start at the point of need. Trigger a short tour the first time the user opens a feature, not on login.
- Split by milestone. Keep each tour to three to five steps and start the next one when the user reaches the next milestone.
Auto-started tours still have a place for the one action every new user must take. Keep that one to one or two steps.
Design rules that follow from the data
- One action per step. If a step asks the user to read and decide, split it.
- Make step 1 the most useful, not the most welcoming. Skip the welcome slide.
- Show progress. "2 of 4" tells users the end is close.
- Always allow skipping and let users come back. A forced tour raises abandonment and annoyance.
- End with the action, not a summary. The final step should be "Create your first report", not "You are all set".
- Test on a small screen. A tooltip that fits on desktop can cover the whole screen of a phone, so check every step at 375 pixels wide.
Completion is not success
A completed tour measures attention, not value. Sample data: of the 337 completers, 60% activated (202); of the 663 who left, 30% activated (199). Overall activation is (202 + 199) ÷ 1,000 = 40.1%. Completers activate twice as often, but this is a selection effect: people who finish were already more motivated. It does not show that the tour caused the difference.
To test whether the tour helps, compare users who were shown the tour with a similar group who were not (for example, a hold-out of new users), and compare activation, not completion. If you cannot hold out a group, compare the weeks before and after the launch and say that the comparison is observational.
What a tour is worth
Put a value on a tour before you build it, so you can compare it with other work. Sample data: 4,000 new users a month, 70% of whom start the tour (2,800), and a tour that lifts activation among starters by 5 points (for example from 30% to 35%). That is 2,800 × 0.05 = 140 extra activated users a month. If an activated user is worth $20 of monthly revenue, the tour adds 140 × 20 = $2,800 a month. If building and maintaining it costs more than that over the period you care about, a shorter or cheaper design is the better choice. If the true lift is 2 points, the gain is 56 users, so check the lift with a hold-out before you invest in more tours.
Overlays, keyboards and screen readers
A tour draws content on top of the page, so it can trap or hide things. WCAG 2.4.11 asks that a focused element is not entirely hidden by author-created content, and its guidance singles out persistent content that opens over the page. Make every tour step dismissible with the Escape key, keep keyboard focus moving in a logical order and never cover the control the step is describing. Test by completing a tour using the keyboard alone.
A measurement plan
Track six events for each tour: started, each step viewed, completed, skipped, closed early and the activation action. From them compute:
| Metric | Formula |
|---|---|
| Start rate | Tours started ÷ eligible users |
| Completion rate | Completed ÷ started |
| Step drop-off | Users lost at a step ÷ users reaching it |
| Skip rate | Skipped ÷ started |
| Activation after tour | Users who did the action within 7 days ÷ users who started |
Use a fixed activation window, such as 7 days, and report it with each number.
In TapCub
TapCub does not build or show product tours; it measures them. You send events from your product, and TapCub reads them.
- In All-platform analytics › Data › Tracking plan, record the tour events (
tour_started,tour_step_viewedwith a step number,tour_completed,tour_skipped) with their properties, and use live verification to confirm they arrive. - Build a funnel from
tour_startedthrough each step to the activation event in All-platform analytics › Behavior › Behavior analysis, and read the loss at each step as in the table above. - Create segments of users who completed and who did not in All-platform analytics › Users › Segments & tags, then compare their retention.
- Use the user profile in All-platform analytics › Users › People to see a single logged-in user's timeline after the tour. This requires you to identify users with
tapcub.login.
TapCub does not run holdout experiments or split traffic; set up the hold-out in your own product and let TapCub measure each group.
FAQ
How many steps should a product tour have?
Three to five for a single tour. In Produktly's 2026 sample, median completion was 73% for 1–2 steps, 38% for 3–5, 25% for 6–8 and 8% for 9 or more. Split longer journeys into several short tours.
What is a good product tour completion rate?
Around 30% overall is typical in published benchmarks: Produktly reports a 29% median and Chameleon a 33.5% average. User-initiated tours do far better, 69% and 64% in the two reports. Compare with your own trigger type.
Should a product tour start automatically?
Only for the one action every new user must take, and keep it to one or two steps. Otherwise start on demand or at the point of need, because auto-started tours had a 23% median completion against 69% for user-initiated ones.
Why do users leave at the first step?
They did not choose the tour and were interrupted. In the sample, 57% of all losses happened at step 1. Fix the trigger and the first screen before cutting later steps.
How do I know a product tour works?
Compare activation, not completion, between users who saw it and a similar group who did not. Completers activate more mainly because they were already motivated.
Sources
- Produktly, SaaS onboarding and in-app engagement benchmarks 2026 (256 tours; 88 companies with 100+ starts; median completion by steps and by start type; updated 13 August 2026). Checked 2026-11-21.
- Chameleon, Benchmark Report 2024 (33.5% average completion; five-step tours 21.6%; checklist-launched tours 64%). Checked 2026-11-21.
- W3C, Understanding SC 2.4.11: Focus Not Obscured (Minimum). Checked 2026-11-21.
Was this article helpful?
We use your answers to fix and expand this page.
Couldn’t send. Please try again in a minute.
Thanks for the feedback. We’ll use it to improve this page.You’ve already sent feedback on this page. Thanks.

Technical Engineer
Focuses on tracking code, SDKs, and API integrations, with practical guidance on implementation checks and troubleshooting.