Try it on your own data
Every report in this article is in the free plan. One snippet for web and apps, up to 10 sites.
Start freeSession analytics analyses visits as units: how long a session lasted, how many pages it had, whether it converted and where it came from. A session is an artificial unit cut by an inactivity timeout (30 minutes by default in GA4 and in TapCub), so tools disagree. Report the median and the share of engaged sessions, not just the mean: in the sample, one idle tab pushed the mean to 136.75 seconds against a 27.5-second median.
What you will learn
- Check each tool's definition of engaged session and bounce rate before comparing numbers across tools
- Use the median, a duration histogram and engagement rate; one idle tab made the mean five times the median
- Judge sources by engagement and conversion together: paid social had 25% of sessions but 8.7% of conversions
What is session analytics, and what does a session answer?
Session analytics is the analysis of visits as units: one session is one continuous stretch of activity by one visitor, and you measure what happened inside it (how long, how many pages, did it convert) and where it came from. It sits between two other views. User-level analysis asks "what does this person do over weeks?". Page-level analysis asks "how does this page perform?". Session analysis asks "what does one visit look like, and which kinds of visits go well?".
That is why sessions are the natural unit for judging traffic sources and landing pages: a source sends visits, and a visit either did something or did not. The catch is that the session is an artificial unit. Someone has to decide where one ends and the next begins, and a different rule gives different numbers.
This guide covers what a session is, the metrics built on it with their exact definitions, why averages mislead and what to use instead, a worked example comparing four sources, and five uses with the steps to run each. For the single-metric view, see session and average session duration.
Which session metrics matter, and how is each one counted?
| Metric | How it is counted | What it tells you | Watch for |
|---|---|---|---|
| Sessions | Visits, cut by the session rule | Volume of visits | Depends on the timeout |
| Engaged session | Longer than 10 seconds, or has a key event, or has 2 or more page or screen views | A visit that did something | The 10-second line is a convention |
| Engagement rate | Engaged sessions ÷ sessions | Share of visits that mattered | Needs at least one key event defined to be meaningful beyond time and pages |
| Bounce rate | Sessions that were not engaged ÷ sessions (GA4); in TapCub, one page view and no custom event | Share of visits that did nothing | Two tools, two definitions |
| Pages per session | Page views ÷ sessions | Depth of visit | A few very long sessions pull it up |
| Average session duration | Total time ÷ sessions | Typical time spent | One long idle tab skews it; see the distribution below |
| Sessions per user | Sessions ÷ users | Return frequency | Anonymous visitors reset when site data is cleared |
| New vs returning share | Sessions flagged first-time ÷ sessions | Mix of audience | Resets with cleared data |
In GA4, an engaged session is one that meets any of three criteria: it lasts longer than 10 seconds, has a key event (what used to be called a conversion), or has 2 or more screen or page views. Engagement rate is the percentage of engaged sessions and bounce rate is its inverse, the percentage of sessions that were not engaged. TapCub's documentation uses the same engagement rule (10 seconds, 2 pages or a key goal) and defines a bounce as a session with a single page view and no custom event, so check each tool's definition before comparing numbers across tools.
Duration deserves care. In TapCub it is the time between the session's last event and its start, in seconds, so a session with a single event has a duration of zero. That does not mean zero attention; it means no second event arrived.
How do tools cut sessions, and why does it change your numbers?
A session ends after a period of inactivity. GA4's default is 30 minutes, adjustable in hours and minutes for web, with no limit on total length. TapCub's default is also 30 minutes idle with a maximum of 24 hours; it does not split sessions at midnight or when an ad parameter changes by default, and it does split a session if the visitor re-enters mid-session from a different external source. A session that crosses midnight is counted on the day it started.
What follows from that:
- Two tools with different rules will never agree exactly. A 15-minute timeout gives more sessions than a 30-minute one for the same activity.
- Cut rules affect source reporting. A visitor who arrives from search, wanders off, and returns from an email 20 minutes later is one session under a 30-minute rule and two under a 15-minute rule, and the second session is credited to email.
- Do not change the rule and compare before-and-after. TapCub applies a changed session rule only to new data; the old and new periods use different definitions.
Why does average session duration mislead, and what should you use?
Session durations are skewed: most visits are short, a few are very long. The mean is dragged up by the long ones.
Sample data: twenty sessions, durations in seconds, sorted: 3, 4, 5, 6, 8, 9, 12, 15, 20, 25, 30, 35, 48, 60, 75, 90, 130, 240, 420, 1,500.
- Mean: the total is 2,735 seconds; 2,735 ÷ 20 = 136.75 s.
- Median: the average of the 10th and 11th values, (25 + 30) ÷ 2 = 27.5 s.
- Share over 10 seconds: 14 of 20 = 70%.
The mean is five times the median because one idle tab (1,500 seconds) contributes 55% of all time (1,500 ÷ 2,735 = 54.8%). A report that says "average session 2 minutes 17 seconds" describes nobody in the list. Use these instead:
- Median duration. What a typical visit looks like.
- A duration histogram with buckets such as under 10 s, 10–30 s, 30–60 s, 1–5 min, over 5 min. Compare the shape across sources, not one number.
- The share of engaged sessions. Here it is at least 70% by the 10-second line alone, before counting page depth and goals.
When one metric must summarise the shape, report the median and the share beyond a threshold together.
Worked example: judging four sources by their sessions
Sample data: one month, four sources, one goal ("started free trial").
| Source | Sessions | Engaged sessions | Engagement rate | Conversions | Conv. rate |
|---|---|---|---|---|---|
| Organic search | 6,000 | 3,600 | 60.0% | 180 | 3.00% |
| Paid social | 3,000 | 900 | 30.0% | 30 | 1.00% |
| 1,500 | 1,125 | 75.0% | 90 | 6.00% | |
| Direct | 1,500 | 825 | 55.0% | 45 | 3.00% |
| Total | 12,000 | 6,450 | 53.75% | 345 | 2.88% |
Checks: sessions 6,000 + 3,000 + 1,500 + 1,500 = 12,000; engaged 3,600 + 900 + 1,125 + 825 = 6,450; blended engagement 6,450 ÷ 12,000 = 53.75%; conversions 180 + 30 + 90 + 45 = 345; blended rate 345 ÷ 12,000 = 2.875%, shown as 2.88%.
Reading it:
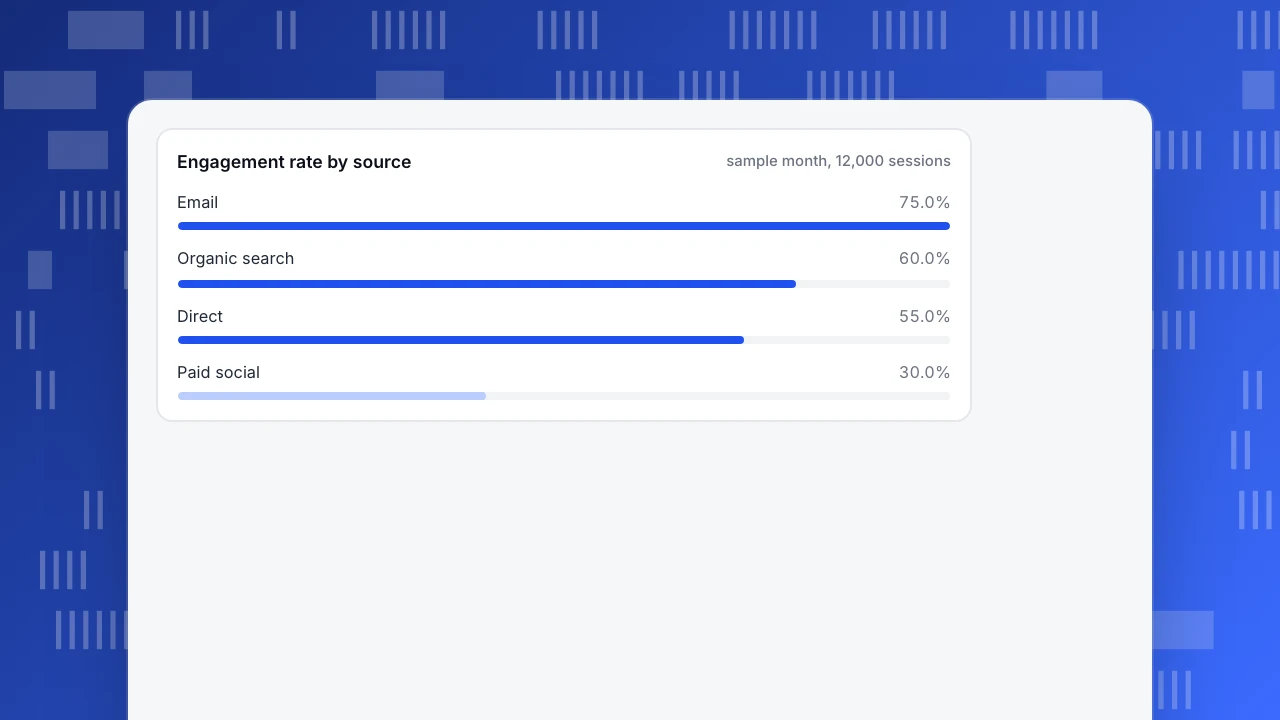
- The blended 53.75% sits between everything and describes no source. Paid social is at 30.0%, little more than half the blended rate.
- Paid social is 25% of sessions (3,000 ÷ 12,000) but only 8.7% of conversions (30 ÷ 345). That mismatch is a prompt to check the landing page, audience or creative for that source.
- Email has the best engagement (75%) and conversion (6.00%) but is the smallest source at 12.5% of sessions; you cannot grow it just by wanting to.
- Engagement rate and conversion rate rank the sources the same way here (email, search, direct, paid social, with search and direct tied on conversion), which is a good sign the 10-second rule is a fair proxy for intent on this site. Check that on your data rather than assuming it.
Engagement rate by source
sample month, 12,000 sessionsWhat are five practical uses, and how do you run each?
- Judge a landing page. Filter sessions to those that entered on that page. Compare engagement rate and conversion rate with the site average. If engagement is low and bounce high, the promise of the ad or link and the page do not match.
- Compare channels. Build the table above. Compare engagement within a medium, and read conversions beside volume.
- Find device or browser problems. Split sessions by device. If one device class has a bounce rate 15 points higher than the rest, check errors and speed for that class before redesigning.
- Measure sessions to convert. For people who converted, count the sessions before the converting one. If most convert on the first session, optimise the landing page; if most need three or more, optimise return paths such as email capture.
- Sample real visits. When a summary number looks odd, open a handful of actual sessions. Aggregates tell you something is off; individual sessions tell you what.
| Use | Question | Start with |
|---|---|---|
| Landing page | Does the page match the promise? | Engagement and conversion for sessions that entered on it |
| Channels | Which sources send visits that matter? | Engagement beside volume, within a medium |
| Devices | Is one device class worse? | Bounce rate split by device, then errors and speed |
| Sessions to convert | How many visits before a conversion? | Count sessions before the converting one |
Sample a few real sessions whenever a summary number looks off.
What pitfalls distort session analytics?
- Bots counted as sessions. Crawlers produce short, single-page sessions that raise bounce rate and lower averages. Exclude them before reading anything.
- Changing the session rule mid-stream. Compare periods under one rule.
- Cross-midnight sessions. A session that spans midnight is counted on the day it started in TapCub; daily and weekly totals differ slightly from a tool that splits at midnight.
- Reading a single page's metrics as a session's. Time on page is different from session duration.
- Comparing tools without checking definitions. Bounce rate means two different things above.
Running session analysis in TapCub
Use the four-source example as the task.
- In Web analytics › Sources, read sessions per channel and source. Click a row to narrow the other reports to that source.
- In Web analytics › Reports, tick the columns you need: sessions, bounce rate, average session duration, pages per session, engagement rate, conversions and conversion rate. Ticked columns are stored in the link, so a shared link shows the same columns.
- In Web analytics › Goals, define the goal ("started free trial") so conversion is the same for every source.
- Open Behavior › Sessions to read individual sessions when a summary looks wrong. A session here is not the same thing as a live-chat conversation.
- For session depth and paths, use All-platform analytics › Behavior › Behavior analysis. Session replay (off by default, turn it on first) is under All-platform analytics › Behavior › Session replay.
Bots and AI crawlers are counted separately, so they do not distort session counts or bounce rate. To change the session rule, edit it in the project's session settings; a changed rule only affects new data.
FAQ
What is session analytics?
It is analysis that treats each visit as a unit: how long it lasted, how many pages it had, whether it converted and where it came from. It is the unit used to judge traffic sources and landing pages.
What metrics does session analytics include?
Sessions, engaged sessions, engagement rate, bounce rate, pages per session, average session duration, sessions per user, and new versus returning share. Definitions differ between tools, so check each.
What is an engaged session?
In GA4, a session that lasts longer than 10 seconds, has a key event, or has 2 or more page or screen views. Engagement rate is engaged sessions as a percentage of all sessions.
How long is a session?
There is no fixed length. It ends after inactivity: 30 minutes by default in GA4 with no maximum, and 30 minutes idle with a 24-hour maximum by default in TapCub.
Why is my average session duration so high?
A few very long sessions, such as an idle tab, pull the mean up. In the sample, the mean was 136.75 seconds and the median 27.5 seconds. Report the median and a histogram.
Sources
Was this article helpful?
We use your answers to fix and expand this page.
Couldn’t send. Please try again in a minute.
Thanks for the feedback. We’ll use it to improve this page.You’ve already sent feedback on this page. Thanks.

Data Analyst
Explores traffic sources, conversion funnels, and retention, using clear metric definitions and concrete examples to explain what the numbers mean.