Try it on your own data
Every report in this article is in the free plan. One snippet for web and apps, up to 10 sites.
Start freeSimple web analytics is six numbers read on a fixed day: visitors, sessions, top sources, top pages, engagement or bounce rate and goal conversion rate, measured against one goal. Anything that does not change a decision can wait. This guide shows a worked two-week report where one source explains a conversion drop, and the rules for when to add more.
What you will learn
- Six numbers and one goal answer the four questions: how many came, from where, what they saw, whether they did the one thing
- Fix one definition of stayed and compare only with your own earlier weeks; separate bots first
- Add a funnel, segment or replay only when a specific question appears; write the decision before adding the report
What simple web analytics has to answer
Simple web analytics means reading a small fixed set of numbers on a fixed day, and acting on the one that moved. It is not a lighter version of a full analytics suite; it is a decision to ask only four questions: how many people came, where they came from, what they looked at, and whether they did the one thing the site exists for.
If a metric does not help answer one of those four, it can wait. A site with 5,000 visits a month does not yet have enough data to make cohort tables or multi-step funnels meaningful. A site with a clear goal and six numbers will notice a broken campaign in a week.
The rest of this article lists the six numbers, shows a sample two-week report with the arithmetic, gives the rules for when to add more, and ends with a 10-minute weekly routine.
The six metrics and the question each one answers
| Metric | Question | How it is calculated |
|---|---|---|
| Visitors | How many people came? | Distinct people (or browsers) in the period |
| Sessions | How many visits was that? | Visits; one visitor can have several |
| Top sources | Where did they come from? | Sessions grouped by channel or source |
| Top pages | What did they look at first and most? | Page views, and sessions that started on the page |
| Engagement or bounce rate | Did they stay? | Share of sessions that stayed, or did not stay, past a rule |
| Goal conversion rate | Did they do the one thing? | Sessions with the goal ÷ sessions |
Page views and average time on site are tempting extras, but neither tells you what to do. A rise in page views can mean more interest or a confusing menu. Add them only when a decision depends on them. The full list of what each metric means is in analytics metrics; if you are still choosing a tool, see web analytics tools.
Visitors and sessions are different counts, and the gap is itself informative. In the sample below, 4,200 visitors made 5,100 sessions, which is 5,100 ÷ 4,200 = 1.21 sessions per visitor. If that ratio jumps to 1.5 with no campaign, people may be returning because something is broken or because an email worked; check sources before celebrating.
Pick the goal before you pick the report. One goal per site is enough to start:
| Site type | A sensible first goal |
|---|---|
| Online store | Order confirmed |
| Lead generation | Contact form sent |
| Content site | Newsletter signup |
| Software product | Account created |
One definition of "stayed"
The engagement metric is the one most often misread, because tools define it differently. Google Analytics 4 calls a session engaged if it lasts longer than 10 seconds, has a key event or has two or more page or screen views; bounce rate is the share of sessions that were not engaged. Other tools count a bounce as a single page view regardless of time.
Two sites with identical behaviour can show 35% in one tool and 55% in another. So pick one tool, write down its rule and compare only against your own earlier weeks. The bounce rate article covers what counts as high.
Also check that bot traffic is separated out. Crawlers rarely run scripts for longer than a second or two and rarely trigger a goal, so they raise bounce and lower conversion rate at the same time.
A sample two-week report
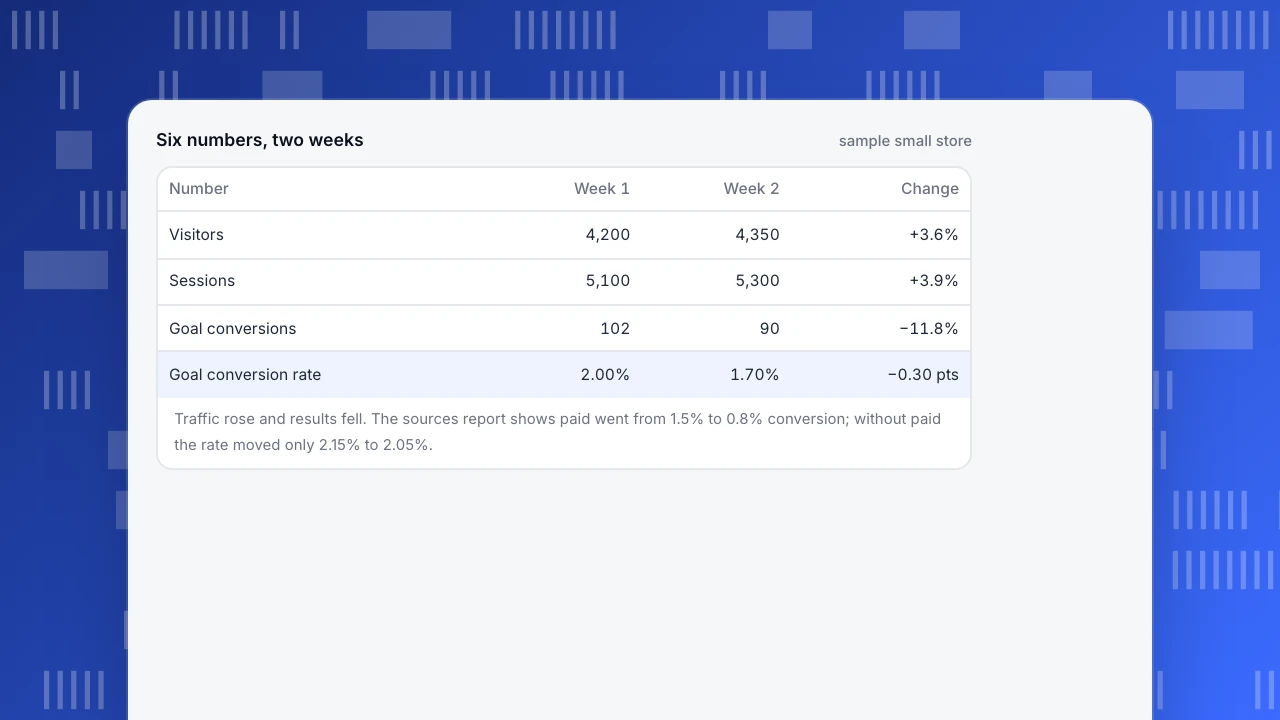
Sample data: a small store's two reports, taken on the same weekday.
| Number | Week 1 | Week 2 | Change |
|---|---|---|---|
| Visitors | 4,200 | 4,350 | +3.6% |
| Sessions | 5,100 | 5,300 | +3.9% |
| Goal conversions | 102 | 90 | −11.8% |
| Goal conversion rate | 2.00% | 1.70% | −0.30 points |
Check the arithmetic: 102 ÷ 5,100 = 2.00%; 90 ÷ 5,300 = 1.698%, which rounds to 1.70%; and (90 − 102) ÷ 102 = −11.8%. Traffic went up and results went down. That is the signal worth opening a second report for.
The question is "where from", so open the sources report:
| Source | Sessions W1 | Conversions W1 | Rate W1 | Sessions W2 | Conversions W2 | Rate W2 |
|---|---|---|---|---|---|---|
| Organic search | 2,300 | 46 | 2.0% | 2,300 | 44 | 1.9% |
| Paid | 1,200 | 18 | 1.5% | 1,500 | 12 | 0.8% |
| 700 | 28 | 4.0% | 700 | 28 | 4.0% | |
| Direct | 900 | 10 | 1.1% | 800 | 6 | 0.75% |
| Total | 5,100 | 102 | 2.00% | 5,300 | 90 | 1.70% |
The paid row shows what changed: 300 more sessions and 6 fewer conversions, so the rate fell from 1.5% to 0.8%. Without paid, the rate was 84 ÷ 3,900 = 2.15% in week 1 and 78 ÷ 3,800 = 2.05% in week 2, a drop of only 0.1 points. One source explains almost the whole fall. The action is specific: look at the new paid campaign's landing page and audience, not at the whole site.
Six numbers, two weeks
sample small store| Number | Week 1 | Week 2 | Change |
|---|---|---|---|
| Visitors | 4,200 | 4,350 | +3.6% |
| Sessions | 5,100 | 5,300 | +3.9% |
| Goal conversions | 102 | 90 | −11.8% |
| Goal conversion rate | 2.00% | 1.70% | −0.30 pts |
Traffic rose and results fell. The sources report shows paid went from 1.5% to 0.8% conversion; without paid the rate moved only 2.15% to 2.05%.
What to skip until a rule says otherwise
Each advanced report earns its place when a specific question appears. Until then it adds numbers without decisions.
| Add this | When this happens |
|---|---|
| Funnel | The goal needs more than two steps and you cannot tell where people leave |
| Segments by device or country | One segment moves the headline number (as paid did above) |
| Event tracking beyond the goal | You have a second goal, such as a download or video play |
| Heatmaps or session replay | A key page converts far below similar pages and you cannot see why |
| Retention or cohorts | You have repeat usage and at least a few hundred returning people a month |
| Custom dashboards | You repeat the same three clicks every week |
A rule of thumb: if you cannot write the decision the new report would change, do not add it yet.
| Add this | When this happens |
|---|---|
| Funnel | The goal needs more than two steps and you cannot see where people leave |
| Segment by device or country | One segment moves the headline number |
| Heatmaps or session replay | A key page converts far below similar pages and the reason is unclear |
If you cannot write the decision a new report would change, do not add it yet.
A single health check for speed
One non-traffic number deserves a place: page speed on real visits. Google's Core Web Vitals give three thresholds, measured at the 75th percentile of page loads, split by mobile and desktop:
- Largest Contentful Paint (LCP): 2.5 seconds or less is good.
- Interaction to Next Paint (INP): 200 milliseconds or less.
- Cumulative Layout Shift (CLS): 0.1 or less.
A page passes only if it meets all three at the 75th percentile. Check them monthly rather than weekly, and look at the worst-performing important page, such as the page where your goal happens. A slow checkout or form page lowers the conversion rate without changing traffic.
Tag your links so the sources report is readable
The sources report is only as clear as the links feeding it. Untagged links in emails, social posts and ads often land in "direct" or a generic bucket, which hides the exact row you need in the sample above. Add three UTM parameters to every link you control:
https://example.com/sale?utm_source=newsletter&utm_medium=email&utm_campaign=nov-sale
Keep three rules. Use lowercase everywhere, because Email and email can show up as two rows. Use one fixed list of medium names (email, paid, social) rather than inventing new ones per campaign. Never tag links between pages of your own site, because that starts a new session and overwrites the real source.
The 10-minute weekly routine
- Pick the same day and range. Compare the last full week with the one before it, same weekdays.
- Read the four headline numbers. Visitors, sessions, goal conversions and conversion rate. Write them in a note next to last week's.
- Decide whether anything moved. Treat a change of less than 10% in a small site's weekly count as noise; with 100 conversions a week, the normal week-to-week wobble is roughly ±10 conversions.
- If conversion rate moved, open sources. Find the row where sessions or rate changed the most, as in the sample.
- If sessions moved, open top pages. Check whether one page or one source drove it.
- Write one action or "no action". A note such as "paid landing page to review by Friday" is the output of the whole routine.
If nothing moved, stop. A report with no action is a good report.
In TapCub
Take the sample report above and rebuild it in TapCub.
- Open Web analytics › Overview. The headline cards give visitors, sessions, page views, bounce rate and average duration with the change against the previous period. Recognised bots are counted separately, so these are human visits.
- Create your one goal in Web analytics › Goals: a page or an event counts as a conversion. The same data appears under All-platform analytics › Business › Goals.
- Open Web analytics › Sources to compare channels and sources, as in the sample table, and Web analytics › Pages for top and entry pages.
- Use Web analytics › Realtime after installing the script to confirm visits arrive before you trust any number.
- For the weekly note, Configuration › Settings › Notifications can subscribe you to a daily, weekly or monthly report; this depends on your plan including subscribed reports.
TapCub does not tell you what to change; it reports the numbers and you decide.
FAQ
What is the simplest way to do web analytics?
Install one script, define one goal and read six numbers once a week: visitors, sessions, top sources, top pages, engagement or bounce rate and goal conversion rate. If nothing moved by more than normal weekly noise, take no action.
Which metrics matter most for a small website?
Goal conversions and conversion rate matter most, then sources (to find out where the conversions come from) and top pages. Visitors and sessions show scale. Page views and time on site are secondary because they do not point to an action.
How many metrics should a simple dashboard have?
Six is a workable ceiling: four headline numbers plus sources and pages. If you cannot write down the decision a metric would change, leave it off. Add more only when a rule triggers, such as a goal that needs a funnel.
Is Google Analytics too complex for a simple site?
It depends on how many reports you open, not on the tool. Any tool becomes simple if you fix six numbers and a weekly day. What matters is that you know its definitions, for example that GA4 counts a session as engaged after 10 seconds, a key event or two page views.
How often should I check my analytics?
Weekly for the six numbers, monthly for page speed. Daily checks on a small site mostly show noise. Use an alert instead of a daily look if you need to know about a sudden drop.
Sources
- Google Analytics Help, Engagement rate and bounce rate (engaged session: over 10 seconds, a key event, or 2+ page or screen views). Checked 2026-11-21.
- web.dev, Web Vitals (LCP 2.5 s, INP 200 ms, CLS 0.1 at the 75th percentile). Checked 2026-11-21.
Was this article helpful?
We use your answers to fix and expand this page.
Couldn’t send. Please try again in a minute.
Thanks for the feedback. We’ll use it to improve this page.You’ve already sent feedback on this page. Thanks.

Customer Experience Consultant
Writes about live chat, visitor conversations, and self-service, sharing practical ways to make customer communication clearer and more effective.