Try it on your own data
Every report in this article is in the free plan. One snippet for web and apps, up to 10 sites.
Start freeReliable data is data whose errors you can predict: it matches a second source within a gap you can explain, is counted rather than sampled, and fires once with the right names. In the sample, a −6.3% gap between analytics and the payments database shrinks to 0.8% once 70 of 80 missing orders are explained.
What makes analytics data reliable
Reliable data is data you can predict the errors of. No analytics setup is exact, so the practical question is not "is it perfect?" but "do I know how far off it is, and does the error stay stable?". Four tests cover most problems: consistency (it matches another source within a known gap), completeness (events and properties arrive when they should), sampling (the number is counted, not estimated from a slice) and tracking correctness (each action fires once, with the right name). The rest of this article turns each into a number you can check. For the wider topic, see data quality and what happens when it fails in the impact of poor data quality.
Test 1: does it match a second source?
Pick one number that exists in two places. Orders are the best candidate because the payments database is a source of truth. The formula is:
Gap = (analytics count − source count) ÷ source count
Sample data: one month shows 1,180 purchases in analytics and 1,260 paid orders in the payments database.
- Gap = (1,180 − 1,260) ÷ 1,260 = −6.3%
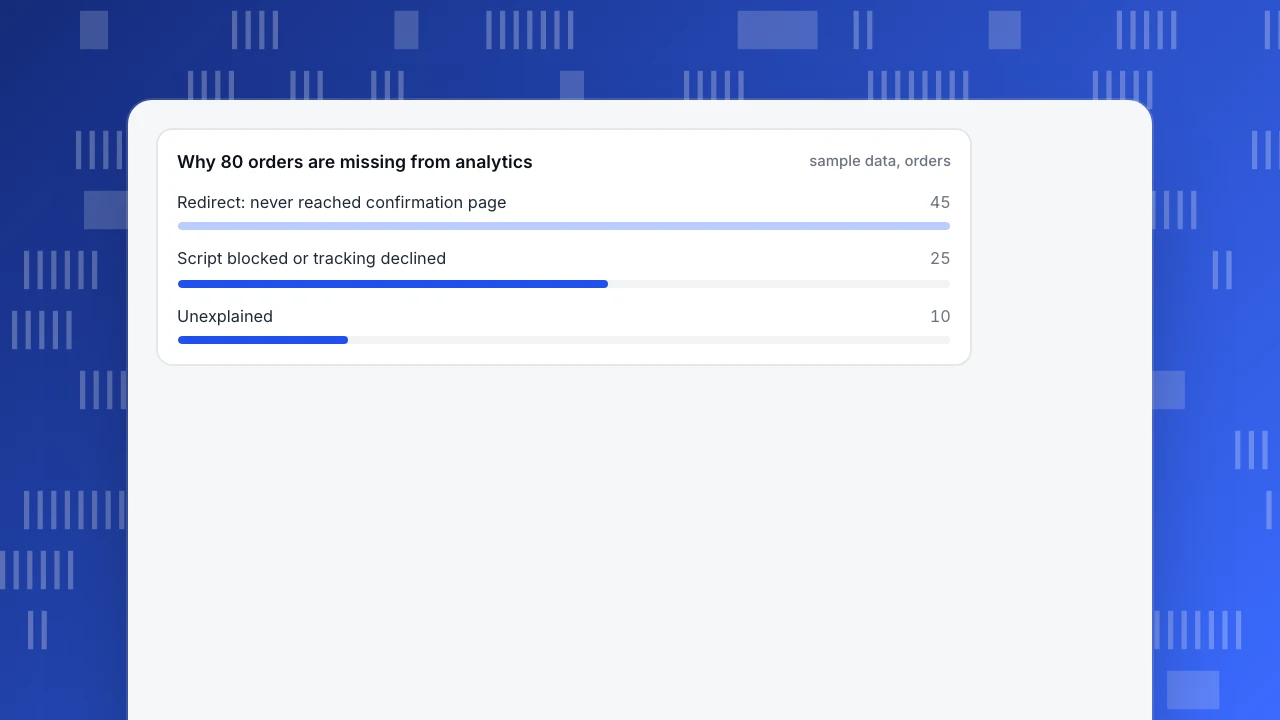
Then explain the 80 missing orders before judging anything. In the sample, 45 were paid through a redirect and never reached the confirmation page, 25 came from visitors whose scripts were blocked or who declined tracking, and 10 are unexplained. That explains 70 of 80 (87.5%), and the residual is 10 ÷ 1,260 = 0.8%.
| Gap after explaining known causes | What it means | What to do |
|---|---|---|
| Under 5% | Normal for browser-side tracking | Note the gap; use the number for trends |
| 5–15% | A cause is probably fixable | Find the biggest cause first (redirects, consent, script load) |
| Over 15%, or a gap that changes month to month | The setup is broken | Do not report the metric until it is fixed |
These cut-offs are rules of thumb we use, not a standard. What matters more is that the gap is explained and stays stable: a steady −6% still lets you compare weeks, while a gap that swings from −2% to −14% does not.
Why 80 orders are missing from analytics
sample data, ordersTest 2: is it sampled, or estimated from a slice?
Some tools estimate a number from part of the data when a query is large. Google's documentation says the quota for event-level queries is 10 million events for standard Google Analytics 4 properties; above that, it uses a portion of the data and scales the result up, and the data quality icon shows what percentage was used. Google also groups rarely seen dimension values into an "(other)" row when a table exceeds its row limit, and treats a dimension with more than 500 values as high-cardinality.
What that does to a number, with sample data: a query covers 25 million events but only 10 million are used, so 40% is sampled and each counted event stands for 2.5. If the sample holds 120 purchases, the report shows 300. A rough 95% margin for a count of 120 is 1.96 ÷ √120 = 17.9%, so the true value is between about 246 and 354. A reported 300 is not wrong, but a week-over-week change of 10% is inside the noise.
Rules: look for the sampling indicator on every report you present; shorten the date range or use a standard report when you see it; and never quote a small segment from a sampled query.
Test 3: audit the tracking itself
Run this eight-point audit before you trust a new setup. Each check is pass or fail:
| # | Check | How to test | Pass if |
|---|---|---|---|
| 1 | Script on every page | Open five page types (home, product, cart, confirmation, 404) | Pageview appears for all five in realtime |
| 2 | Each action fires once | Click one button once | One event, not two |
| 3 | Event names are consistent | Sort event names alphabetically | No signup / sign_up / SignUp triples |
| 4 | Required properties arrive | Count events with the property empty | Under 2% empty |
| 5 | Internal traffic excluded | Visit from the office | Your visit is excluded or flagged |
| 6 | Bots removed | Compare requests to visitors | Known crawlers counted separately |
| 7 | Time zone and currency set | Check one known timestamp and price | Matches the source |
| 8 | Final step reconciles | Test 1 | Gap explained |
Seven passes out of eight is not "good": a single failed check on the purchase event matters more than five harmless passes. Fix failures in order of how close they sit to revenue.
Test 4: sanity ratios that expose double-firing
Some errors show up as odd ratios before you see them in any detail. Sample data: a site reports 52,000 pageviews and 26,000 sessions in a day. That is exactly 2.00 pages per session, with a bounce rate of 0%. Real traffic almost never produces both: a bounce rate of zero means nobody leaves after one page, and an exact 2.00 means every pageview was counted twice. This usually comes from the script being installed twice, for example once in the theme and once through a tag manager.
| Ratio | Suspicious value | Likely cause |
|---|---|---|
| Pageviews ÷ sessions | Exactly 2.00 or 3.00 | Script installed twice |
| Bounce rate | 0% or 100% | Event sent on load, or tracking only the first page |
| Events with empty required property | Over 5% | A code path that skips the property |
| Direct share | Sudden rise above 60% | Redirects stripping referrers or UTM tags |
Test 5: does it arrive on time?
Late data makes yesterday's number wrong today. Check two things: how long events take to appear (open realtime, trigger an event, time it), and whether data sent from servers keeps its original time. In TapCub, historical events sent through the server interface that are more than 72 hours old have their event time changed to the time received, so a backfill older than three days will land on the wrong day. For every metric you report, note the delay and do not compare a full day with a partial one.
Where gaps usually come from, and how to size each
When a gap appears, size each cause separately instead of guessing. Use this list, and for each cause write the number of orders it explains:
| Cause | How to size it | Fix |
|---|---|---|
| Buyer leaves for an external payment page and never returns | Orders with a payment ID but no confirmation-page event | Send the purchase event from the server when the payment is confirmed |
| Script blocked, or tracking declined | Compare server-side order count with browser-side events for the same hour | Add a server-side event for key conversions |
| Test and staff orders in the database | Filter by test flag or internal email domain | Exclude them from the source count |
| Refunds and cancellations counted differently | Compare gross vs net in both systems | Pick one definition and write it down |
| Time zone mismatch at midnight | Re-run the count with both systems in one zone | Set the same zone everywhere |
| Duplicate events on page reload | Count purchase events with the same order ID | Deduplicate on order ID |
Run the same reconciliation on the same day every week for a month. A gap that repeats within one or two points is a property of your setup and can be tolerated; a gap that jumps after a release points at that release.
Keep a short log beside the scorecard: date, metric, gap, cause, who checked it. When someone asks in six months why a number changed, the log answers in one line instead of a week of digging.
A one-page reliability scorecard
Write one row per metric you report to others:
| Metric | Source cross-checked | Gap | Sampled? | Audit passes | Verdict |
|---|---|---|---|---|---|
| Purchases | Payments database | −0.8% after explained causes | No | 8 of 8 | Reliable, report as is |
| Signup start | None | n/a | No | 6 of 8 | Use for trends only |
| Revenue by segment | Payments database | Not tested | Yes (40%) | 7 of 8 | Do not quote small segments |
A metric with no cross-check is not unreliable, only unproven. Say so in the report, and schedule the first cross-check for the metric that feeds the most expensive decision.
| Test | What you check | Pass if |
|---|---|---|
| Consistency | Gap vs second source | Under 5% after explaining causes, and stable |
| Sampling | Sampling indicator on the report | Not sampled, or not quoted for small segments |
| Tracking audit | Eight pass/fail checks | Checks on revenue events all pass |
| Sanity ratios | Pageviews per session, bounce rate | No exact 2.00 or 0% |
| Timing | Delay between action and report | Known and stable |
The 5% and 15% cut-offs are rules of thumb, not a standard.
How to do it in TapCub
Walk through the five tests in TapCub:
- Cross-check the final step. Compare the goal or purchase count in Web analytics › Goals with your own database using the gap formula. Counts in the console are real counts, not samples of a slice.
- Verify the event plan. In All-platform analytics › Data › Tracking plan, turn on Live verification (24 h). It adds hits in 24 hours and completeness of required properties per event; low completeness is a warning and does not block intake.
- Clean the names. New events land in Event inbox until someone claims them, and Property dictionary keeps names and types in one place, which addresses the
signup/sign_upproblem. - Separate bots. Recognised bots are counted in Web analytics › Bots, not in visitors, so they do not distort ratios.
- Watch it over time. All-platform analytics › Operations › Monitors can check error_rate or a saved metric on a schedule and notify you; it only notifies and does not fix anything. TapCub does not audit your tags for you, so run the eight-point audit yourself.
FAQ
How do you know if your analytics data is reliable?
Check four things: it matches a second source within a gap you can explain, it is not sampled, events fire once with the right names, and required properties arrive. In the sample, a −6.3% order gap was explained down to 0.8%.
How much discrepancy between analytics and a database is normal?
Under about 5% is common for browser-side tracking, because of blocked scripts and redirects. Treat 5–15% as a fixable cause and over 15% as broken. These are rules of thumb; a stable, explained gap matters more than the size.
What is data sampling in analytics?
Sampling is estimating a result from part of the data when a query is large. In Google Analytics 4 standard properties the event-level quota is 10 million events; above it results are scaled up from a portion of the data.
How do you detect duplicate tracking?
Look for a pageviews-to-sessions ratio of exactly 2.00 or 3.00 and a 0% bounce rate, then check whether the script is installed twice, once in the theme and once through a tag manager.
How often should you audit tracking?
After every release that touches checkout, signup or the script itself, and quarterly otherwise.
Sources
- Google Analytics Help, About data sampling (10 million events quota for standard properties).
- Google Analytics Help, About the (other) row (rarely seen values grouped when a table exceeds its row limit; 500 values as high-cardinality guidance).
- TapCub documentation, Tracking plan and Data import (docs.tapcub.com), checked 2026-11-21.
Was this article helpful?
We use your answers to fix and expand this page.
Couldn’t send. Please try again in a minute.
Thanks for the feedback. We’ll use it to improve this page.You’ve already sent feedback on this page. Thanks.

Customer Experience Consultant
Writes about live chat, visitor conversations, and self-service, sharing practical ways to make customer communication clearer and more effective.