Try it on your own data
Every report in this article is in the free plan. One snippet for web and apps, up to 10 sites.
Start freeMarketing to developers works when documentation leads, claims can be tested and success is measured by activation, not clicks. In Stack Overflow's 2024 survey, 83.9% of respondents who use online resources to learn rely on technical documentation, so the docs are your biggest channel; judge each channel by activated developers per 1,000 sessions.
What you will learn
- Docs are the front door: 83.9% of developers who learn online use technical documentation
- One metric per tactic: docs-to-signup, post-to-docs click, community activation, 7-day activation rate
- Compare channels by activated developers per 1,000 sessions: in the sample docs give 20.2 and the blog 3.0
Why developers need a different marketing approach
Marketing to developers means earning attention from people who evaluate tools by trying them, reading documentation and checking claims, so the work looks more like publishing and product than advertising. Stack Overflow's 2024 Developer Survey shows where they actually learn. Among the 48,822 respondents who answered the question on online resources, 83.9% use technical documentation to learn to code, 80.3% use Stack Overflow, 68.4% use written tutorials, 61.4% use blogs and 54.2% use how-to videos. Of those who use documentation, 90.3% name API and SDK documents as the kind they use most.
Two lessons follow. First, your documentation is a marketing channel and often the largest one, because it is where the decision to adopt is made. Second, verification is habitual: in Stack Overflow's 2025 survey (over 49,000 responses), 46% of developers said they distrust the accuracy of AI tools, against 33% who trust it. An audience that double-checks AI will double-check your landing page. Claims should be specific and testable.
The rest of this article covers five tactics that work with that behaviour, the metrics for each and a channel table you can reproduce. For the wider software-company playbook, see SaaS marketing and product-led growth strategy.
Tactic 1: make the docs the front door
Put the shortest path to a working result at the top of the docs: install, one call, one visible output. Then treat docs as a product with owners and a changelog.
What to measure: docs-to-signup rate (sessions on docs pages that end in a signup) and time to first successful call. A quickstart that takes 10 minutes to reach a result will convert fewer people than one that takes 2.
Rules that help:
- One code sample per language, tested in CI so it never breaks silently.
- Every page ends with the next step, not a dead end.
- Search is part of docs: log what people search for and find nothing.
| Tactic | What to measure |
|---|---|
| Docs as the front door | Docs-to-signup rate; time to first successful call |
| Problem-solving content | Post-to-docs click rate; signups within 7 days |
| Community answers | Campaign-tagged sessions; signup and activation rate |
| Free way to try | 7-day activation rate |
| Changelog and status page | Returning visits to changelog and docs; tickets after releases |
One metric per tactic keeps the programme honest.
Tactic 2: publish solutions to problems, not announcements
Developers arrive from search with a specific problem: an error message, a migration, a comparison. A post that fully solves it earns trust, links and a later signup. A post that announces a feature earns an hour of attention.
Pick topics from your support tickets and docs search logs, because both list real problems in the audience's own words. Write each post so that it works without your product, then show where your product removes steps. Include the code, the result and the version it was tested on.
What to measure: sessions from organic search to the post, then post-to-docs click rate and signups within 7 days. In the sample below, the blog sends 3,000 sessions but converts at 0.9%, much lower than docs. That is normal: blog readers are earlier in their decision, so judge posts by how many docs visits they create.
Tactic 3: show up in the places developers already ask
Answer questions in the forums, issue trackers and chat communities where your users are, under a real name, with a disclosed affiliation. Do not paste links to your product into threads that do not need them; a useful, complete answer with a link only when it applies builds a reputation that ads cannot.
What to measure: sessions tagged with a campaign for each community, signup rate and activation. Community traffic is small but it activates well: in the sample, 56.2% of community signups reach first use against 33.3% for social.
Tactic 4: give a free way to try it, without a sales call
For a developer tool, "try it" means an account or an API key in minutes, with no form that asks about company size. Offer a free tier or sandbox and show usage limits on the page. If your product needs approval, say how long it takes.
What to measure: activation rate, the share of signups who complete the first meaningful action within seven days (a first event received, a first successful request). It is a better target than signups, because signups that never use the product only inflate the number.
Tactic 5: keep a changelog and an honest status page
Developers read changelogs and judge a vendor on how it handles breaking changes and incidents. Publish each release with the date, what changed, and migration steps for anything that breaks. State incidents plainly with times. This is trust work that has a measurable footprint: returning visits to the changelog and docs from existing users, and fewer support tickets after a release. Make breaking changes boring: announce them one release ahead, keep the old behaviour behind a flag for a stated period and say when it ends.
Write claims a developer can check
A developer reading your landing page will test it. Replace adjectives with statements that can be verified in under ten minutes, and link the method.
| Instead of | Write | Why it holds up |
|---|---|---|
| "Blazing fast" | "Median response 180 ms, 95th percentile 420 ms, measured over 7 days (method linked)" | A number, a window and a method |
| "Easy to integrate" | "One install command and 6 lines to send the first event" | A count the reader can verify |
| "Enterprise-grade" | "Data stored in the EU region; retention set per project; export on request" | Concrete behaviour |
| "Trusted by thousands" | Link to the public status page and changelog | Evidence the reader can open |
These are example rewrites; use only numbers you have measured. The test is simple: could the reader prove you wrong in ten minutes? If not, the sentence is decoration.
A 30-day plan to start
Week 1: pick one audience and one job, list the five questions it asks most (from support and docs search), and set the three goals you will measure (signup, first successful call, 7-day activation). Week 2: rewrite the quickstart and add tested samples for the main language. Week 3: publish two problem-solving posts from the question list and answer ten real questions in one community. Week 4: read the channel table, keep what activated people, and cut one thing that did not. Repeat monthly, and do not add a channel until the first has at least 30 signups.
Channel-by-channel metrics: a table you can copy
Sample data: 10,000 developer sessions in one month, tagged by source.
| Channel | Sessions | Signups | Signup rate | Activated in 7 days | Activation rate | Activated per 1,000 sessions |
|---|---|---|---|---|---|---|
| Docs | 4,000 | 124 | 3.1% | 81 | 65.3% | 20.2 |
| Blog | 3,000 | 27 | 0.9% | 9 | 33.3% | 3.0 |
| Newsletter | 1,200 | 19 | 1.6% | 11 | 57.9% | 9.2 |
| Community | 900 | 16 | 1.8% | 9 | 56.2% | 10.0 |
| Social | 700 | 3 | 0.4% | 1 | 33.3% | 1.4 |
| Paid search | 200 | 0 | 0.0% | 0 | n/a | 0.0 |
| Total | 10,000 | 189 | 1.9% | 111 | 58.7% | 11.1 |
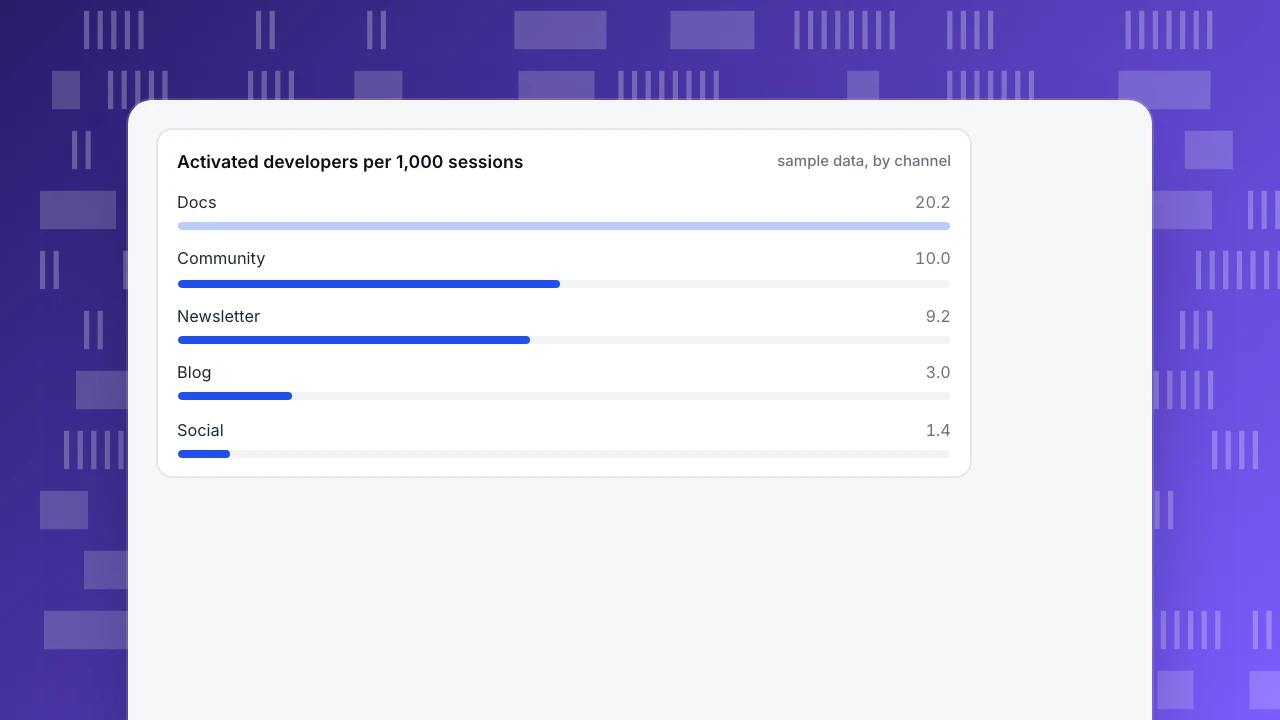
Read the last column first: it combines reach, signup and activation into one comparable number. Docs produce 20.2 activated developers per 1,000 sessions, about seven times the blog's 3.0.
Check the docs-blog gap is not noise: a two-proportion z-test on signup rates (124 of 4,000 against 27 of 3,000) gives z = 6.3, far above 1.96. The social and paid rows rest on 3 and 0 signups and should not be compared; wait for at least 30 signups per channel before ranking it.
Activated developers per 1,000 sessions
sample data, by channelRun this measurement in TapCub
Reproduce the channel table for your own site.
- Tag the links. Use UTM parameters on every link you control in newsletters, community posts and social (see naming UTM parameters). Web analytics › Sources then splits sessions by channel, referrer and UTM, with a conversions column.
- Define the goals. In Web analytics › Goals, define signup and the first meaningful action as goals. Send server-side events for actions that happen in your API, using the HTTP interface.
- Count the clicks out of the docs. The website script collects outbound link clicks (to a different domain, such as your GitHub repository) and file downloads by default, so the docs page that sends people to the repo is visible.
- Follow the path. In All-platform analytics › Behavior › Behavior analysis, build a funnel from docs page, to signup, to first API event, and break it down by source. It shows count, step rates and the median time to complete.
- Keep bots out. Docs pages are read heavily by crawlers. Web analytics › Bots separates crawlers and AI agents from visitors, so your docs traffic and conversion rates count people only.
TapCub measures what happens after the click; it does not run community outreach or advertising, and it is not an install-attribution service.
FAQ
How do you market to developers?
Make documentation the front door, publish solutions to specific problems, take part in the communities where developers already ask questions, offer a free way to try the product without a sales call and keep an honest changelog. Measure activation, not only signups.
Why is marketing to developers different?
Developers evaluate tools by using them and reading documentation, and they check claims. In Stack Overflow's 2024 survey, 83.9% of respondents who use online resources to learn use technical documentation. Promotional language that cannot be tested loses trust quickly.
What channels work best for developer marketing?
Judge channels by activated developers per 1,000 sessions, not by traffic. In the sample, docs gave 20.2, community 10.0, newsletter 9.2, blog 3.0 and social 1.4. Your numbers will differ; the method is what to copy.
How do you measure developer marketing?
Tag every link with UTM parameters, define goals for signup and first meaningful action, and compute signup rate, activation rate within seven days and activated developers per 1,000 sessions for each channel. Compare channels only once each has at least 30 conversions.
Should developer marketing use paid ads?
It can, but the audience is wary of promotion, so test small and measure to activation. In the sample, 200 paid sessions produced no signups. A result that small proves nothing, so run a larger test before deciding.
How do you reach developers without sounding like an ad?
Write for the problem, not the product. Show the code, the result and the version tested, state limits and trade-offs plainly, and sign with a real name and role. Developers forgive a product that is missing something; they do not forgive a page that hides it.
Sources
- Stack Overflow, 2024 Developer Survey: Developer Profile: online resources used to learn to code (83.9% technical documentation; 80.3% Stack Overflow; 68.4% tutorials; 61.4% blogs; 54.2% videos); 90.3% API and SDK documents. Checked 2026-11-21.
- Stack Overflow, 2025 Developer Survey: over 49,000 responses; 33% trust and 46% distrust the accuracy of AI tools. Checked 2026-11-21.
Was this article helpful?
We use your answers to fix and expand this page.
Couldn’t send. Please try again in a minute.
Thanks for the feedback. We’ll use it to improve this page.You’ve already sent feedback on this page. Thanks.

Product Adoption Consultant
Explores customer onboarding, live conversations, and self-service, turning common usage questions into practical guidance and improvements.