Try it on your own data
Every report in this article is in the free plan. One snippet for web and apps, up to 10 sites.
Start freeMarketing mix modelling (MMM) is a statistical model on aggregate data, such as weekly sales and spend per channel, that estimates each channel's contribution, how long its effect lasts and where extra spend stops paying. Unlike attribution it needs no individual tracking and can include offline channels and baseline sales. Below: the inputs, adstock and saturation with numbers, how to read the output and when it is worth building.
What you will learn
- MMM answers where to move budget between channels; attribution answers which touches converting visitors had
- Check observations against parameters: 104 weeks and 21 parameters is only about 5 observations each
- Read next-dollar return from the response curve, and calibrate against an experiment before reallocating
What marketing mix modelling does
Marketing mix modelling (MMM, also written marketing mix modeling) is a statistical model fitted to aggregate time series. You give it a business outcome per period, such as weekly sales, and the marketing activity per period, such as spend or impressions for each channel. It estimates how much of the outcome each channel explains, how fast the effect fades and where extra spend stops paying. It never follows individual people, which is why it can include television, print and promotions, and why it keeps working when cookies and device IDs do not.
Google's open-source Meridian documentation lists the inputs as a target KPI (often sales), media data for each channel, optional control variables, optional geo-level data and optional reach and frequency data. Google researchers Jin and colleagues (2017) argued that the model has to capture two features of advertising: carryover (an ad keeps working after the week it ran) and shape (each extra dollar buys less than the one before). Everything else in this guide follows from those two ideas.
The question MMM answers is: "If I move budget between channels next quarter, what happens to the outcome?" The question multi-touch attribution answers is different: "Which touches did the converting visitors have?" The comparison section below sets the two side by side; for the term itself see media mix modelling.
What data does it need?
| Input | Granularity | What goes wrong |
|---|---|---|
| Outcome (sales, orders, signups) | One row per week (or per day) | Mixing definitions across time, such as refunds counted in some months only |
| Media activity per channel | Spend or impressions, same rows | Spend booked in a different week from when the ads ran |
| Controls | Price, promotions, holidays, seasonality, competitor events, weather where relevant | Leaving out a driver, so a channel gets credit for it |
| Geography (optional) | Same variables per region | Regions that are not comparable |
| Experiment results (optional) | Lift-test or geo-test estimates | Using them for the wrong period or audience |
Count the observations against the parameters before you start. Sample arithmetic: 104 weeks of data and five channels, each with three parameters (how fast the effect fades, how steep the curve is, where it flattens), plus six control terms, is 5 × 3 + 6 = 21 parameters. That is 104 ÷ 21 ≈ 5.0 observations per parameter. The thinner that ratio, the more the answer is driven by the modeller's assumptions rather than the data, so the assumptions need to be written down and tested.
Channels whose spend moves together, for example search and social always scaled up at Black Friday, cannot be separated by the model. Vary spend on purpose in a few weeks if you want a usable answer later.
How does it model carryover and diminishing returns?
Two transformations are applied to each channel's spend before it enters the regression. Meta's open-source Robyn documentation names the common choices: geometric adstocking (a one-parameter exponential decay) and the Hill function for saturation.
Carryover (adstock). With a decay rate of 0.5, each week keeps half of the previous week's effect. Sample data: $100 spent in week 1 and nothing after gives an adstocked series of 100, 50, 25, 12.5, 6.25 and so on. The total effect is 100 ÷ (1 − 0.5) = 200, twice the spend in the week it ran. A faster decay (0.2) leaves 125, so the total is lower and sooner.
Saturation (diminishing returns). A Hill curve turns adstocked spend into effect: effect = x^a ÷ (x^a + g^a), with shape a = 1.5 and half-saturation point g = 50 ($k per week). Scaled to 1,000 weekly orders at full saturation:
| Weekly spend | Orders from the channel | Extra orders from the next $10k |
|---|---|---|
| $20k | 202 | |
| $40k | 417 | +82.9 |
| $60k | 568 | +55.6 |
| $80k | 669 | |
| $100k | 739 | +26.6 |
Going from $40k to $50k buys 82.9 more orders; going from $100k to $110k buys 26.6. That is why a channel with the best average return is not always the one to feed: what matters for moving budget is the return on the next dollar, which the response curve gives you and a simple average does not.
What does the output look like?
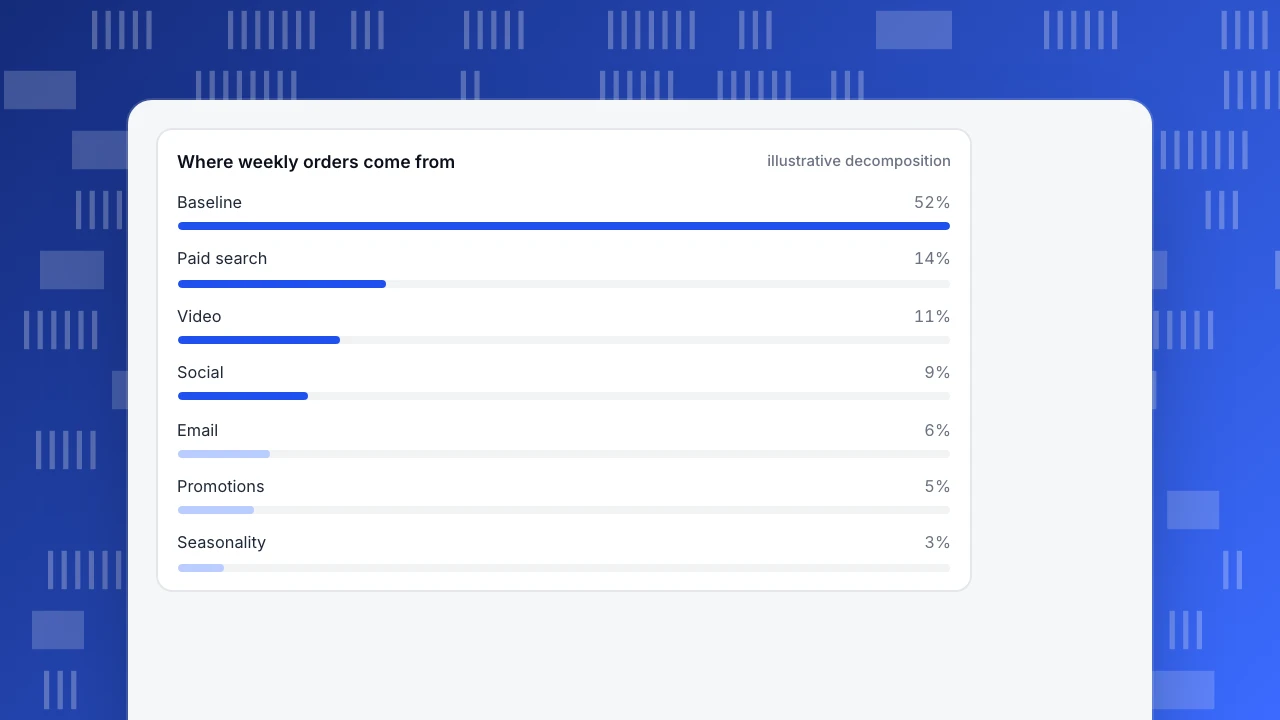
MMM returns two things: a decomposition of the outcome into a baseline and channel contributions, and the response curve for each channel. A sample decomposition for one year (illustrative, not a benchmark):
| Component | Share of weekly orders |
|---|---|
| Baseline (brand, word of mouth, repeat customers) | 52% |
| Paid search | 14% |
| Video | 11% |
| Social | 9% |
| 6% | |
| Promotions | 5% |
| Seasonality | 3% |
The shares sum to 100%. Three habits make this table safe to use:
- Ask for ranges, not points. A Bayesian model such as Meridian's returns a posterior distribution; a channel at "11%" might be 6% to 15%. If two channels' ranges overlap heavily, do not move large budgets between them on the strength of the point estimates.
- Read response curves, not just shares. A channel with a large share but a flat curve is saturated; a small share with a steep curve is the place to test more spend.
- Convert to the next-dollar return (as in the table above) before reallocating.
Where weekly orders come from
illustrative decompositionMMM versus attribution: when does each apply?
| Marketing mix modelling | Attribution | |
|---|---|---|
| Data | Aggregate time series (weekly spend and outcomes) | User-level paths before a conversion |
| Needs individual tracking | No | Yes |
| Offline channels and promotions | Can be included | Only if the touch is recorded |
| Baseline sales (would have happened anyway) | Estimated explicitly | Not estimated: every conversion has some credit to give |
| Speed | Weeks to build; refreshed monthly or quarterly | Daily |
| Granularity | Channel, region | Campaign, source, landing page |
| Strength | Budget allocation across channels | Which sources and pages sit on converting paths |
| Weakness | Needs variation in spend and enough history | Credit rules (first, last, linear) are conventions, not measurements of causation |
They are complements. Attribution tells you, quickly, which campaigns appear in converting journeys; MMM tells you, more slowly, what the whole mix is worth. When they disagree, the usual reasons are channels that only assist (they appear in paths but add no sales on their own) and channels that attribution cannot see. Use experiments, such as a geo holdout, to settle the argument; Robyn's documentation includes calibrating the model against causal experiments for the same reason, and cites a third-party whitepaper finding that uncalibrated models average about 25% from ground truth.
| Question | Better tool | Why |
|---|---|---|
| Which campaigns appear in converting journeys? | Attribution | User-level paths, daily |
| How much did TV and promotions add? | MMM | Works on aggregate data, no tracking needed |
| Where does the next $10k add the most? | MMM response curves | Models diminishing returns |
| Was this channel's effect real? | Experiment (geo or lift test) | Isolates causation; also used to calibrate MMM |
Use both: attribution for campaign tuning, MMM for the budget across channels.
When is MMM worth doing, and when is it not?
Decide with these rules.
- Worth it if you spend across three or more channels, some of them without click-level tracking; you have at least a couple of years of consistent weekly data; and you will actually move budget based on the result.
- Not yet if one channel is almost all your spend (a simple before-and-after or holdout test is cheaper), if the history is under a year, or if every channel was always scaled up together.
- Start with a simpler model if the number of parameters is close to the number of weeks. Fewer channels, grouped, are better than 12 channels fitted to 52 data points.
- Plan the refresh. A model that is not re-fitted when the mix changes tells you about last year.
How do you check that the model is right?
Three checks, in order of cost.
- Hold out the last 13 weeks (or similar), fit on the rest and predict them. Mean absolute percentage error (MAPE) = average of |actual − predicted| ÷ actual. Sample data, six held-out weeks: actual orders 520, 540, 510, 560, 600, 580; predicted 500, 555, 530, 540, 570, 610. Errors: 3.85%, 2.78%, 3.92%, 3.57%, 5.00%, 5.17%, mean 4.05%. Good fit to the past is necessary, not sufficient: many different channel splits fit the same history.
- Compare with an experiment. If a geo test says search added 8% to orders and the model says 14%, one of them is wrong. Calibrate or investigate before trusting the allocation.
- Check the signs. A channel with a negative contribution is almost always an omitted control or collinearity, not a channel that destroys sales.
Common mistakes
- Treating the baseline as zero. Without it every sale is credited to a channel.
- Fitting too many channels to too little data. See the observations-per-parameter count above.
- Reading one fitted split as the truth. Look at the range and the sensitivity to priors.
- Mismatched dates. Spend recorded when invoiced rather than when ads ran shifts the carryover estimate.
- Using the output for the wrong decision. MMM is for budget between channels, not for deciding which headline to run.
- Forgetting bots in the outcome. If the outcome is web conversions, automated traffic should be excluded, or the model fits noise.
Preparing MMM inputs in TapCub
Take the sample year. You spend across search, video, social and email and want a weekly table for a model, plus a sanity check.
- Get the outcome by week. Define the goal in Web analytics › Goals, then read conversions per day in Web analytics › Sources by channel and UTM campaign. Recognised bots are counted separately in Web analytics › Bots, so they stay out of visitor and conversion counts.
- Add the spend. In All-platform analytics › Business › Channel ROI, import spend by day, channel, source and campaign (CSV or one by one). The page then shows cost per click and cost per acquisition by channel, a quick view before any modelling.
- Export for the model. Use All-platform analytics › Data › Data export for an asynchronous export of the underlying data, and aggregate to weeks in your own tool.
- Mark what changed. Add Configuration › Annotations for launches, promotions and price changes so the controls in your model match what actually happened.
- Run the cross-check. In All-platform analytics › Behavior › Behavior analysis, compare first, last, linear, position and time-decay credit side by side. Channels that only assist show up as columns where credit differs sharply, which are the ones to look at in the model's response curves.
Know the boundary: TapCub does not fit marketing mix models and does not run experiments. It supplies the channel-level outcome and spend tables and the attribution view; the modelling happens in your own statistical tool.
FAQ
What is marketing mix modelling?
Marketing mix modelling is a statistical model on aggregate data, such as weekly sales and spend per channel. It estimates each channel's contribution, how long its effect lasts and where extra spend stops paying, so you can allocate budget across channels. It does not need individual-level tracking.
What data do you need for MMM?
An outcome such as weekly sales, spend or impressions per channel for the same weeks, and controls such as price, promotions, holidays and seasonality. Geography and experiment results are optional but make the model more reliable. Check that observations comfortably outnumber parameters.
What is the difference between MMM and attribution?
Attribution uses user-level paths before a conversion and runs daily; it shows which sources and pages sit on converting journeys. MMM uses aggregate time series, includes offline channels and baseline sales, and refreshes monthly or quarterly. Use attribution for campaign tuning and MMM for budget across channels.
How long does an MMM take?
Building and checking a model usually takes weeks, mostly spent on data cleaning and validation rather than fitting. After that it is refreshed on a monthly or quarterly rhythm, or whenever the mix changes sharply.
What are adstock and saturation?
Adstock is carryover: with a decay of 0.5, $100 spent in week 1 leaves effects of 50, 25 and 12.5 in the following weeks. Saturation is diminishing returns: in the example curve, the next $10k bought 82.9 orders at $40k a week but only 26.6 at $100k.
Sources
- Google Developers. Meridian documentation: about the project. Inputs: KPI, media per channel, optional controls, geo and reach and frequency data; Bayesian posterior output. Checked 2026-11-21.
- Meta. Robyn documentation: features. Geometric adstocking, Hill saturation, calibration with causal experiments, third-party whitepaper finding about 25% average difference for uncalibrated models. Checked 2026-11-21.
- Yuxue Jin, Yueqing Wang, Yunting Sun, David Chan & Jim Koehler. Bayesian Methods for Media Mix Modeling with Carryover and Shape Effects. Google Research, 2017. Checked 2026-11-21.
Was this article helpful?
We use your answers to fix and expand this page.
Couldn’t send. Please try again in a minute.
Thanks for the feedback. We’ll use it to improve this page.You’ve already sent feedback on this page. Thanks.

Data Engineer
Writes about event design, data quality, and collection workflows, with verifiable implementation methods for reliable analytics.