Try it on your own data
Every report in this article is in the free plan. One snippet for web and apps, up to 10 sites.
Start freeMarketing budget optimization is moving a fixed budget between channels so the next dollar goes where it returns the most. Rank channels by marginal ROAS, not average ROAS, and compare each with break-even ROAS (1 divided by gross margin). In the sample, search has the best average (3.92) but the worst marginal (2.10), and moving $3,000 adds $1,199 of revenue.
What you will learn
- Average ROAS describes the past; marginal ROAS describes the next dollar, and the two can rank channels in opposite order
- Compare marginal ROAS with break-even ROAS (1 ÷ gross margin = 2.5 at 40%): in the sample only social pays for itself at the margin
- Move 10–20% at a time, keep floors for brand and about 10% for tests, and verify the biggest move with a holdout
What marketing budget optimization actually is
Marketing budget optimization is moving a fixed budget between channels so that the next dollar goes where it returns the most. It is different from cutting spend and different from picking the channel with the best average return. The key idea is that each channel has a point where extra spend returns less than the spend before it, so the best allocation is the one where the next dollar returns about the same everywhere.
Gartner's 2025 CMO Spend Survey, run in February and March 2025 among 402 marketing leaders in North America, the UK and Europe, found that average marketing budgets were flat at 7.7% of company revenue for a second year, with paid media taking about 30.6% of the budget, or 2.4% of revenue. When totals stop growing, the only lever left is where the money goes. For related framing see marketing optimization and how to calculate ROAS; this article is about the reallocation step.
Where the total comes from
Optimisation works inside a total, so settle the total first. A common top-down check is budget as a share of revenue. Gartner's survey found half of the leaders reported budgets of 6% of revenue or less, against the 7.7% average. Sample data: a company with $2,000,000 of revenue would have $120,000 at 6% and $154,000 at 7.7%, and if paid media took 30.6% of the larger figure it would be about $47,124. Use such ratios as a sanity check, not a target; the better test of the total is whether the marginal ROAS of your last dollar is above break-even.
Average return versus marginal return
Return on ad spend (ROAS) is conversion value divided by cost. Two versions matter:
- Average ROAS = total revenue ÷ total spend for the channel. It describes the past.
- Marginal ROAS = extra revenue ÷ extra spend for the next increment. It describes the decision.
A channel can have the best average and a poor marginal. The first dollars go to the best keywords or audiences; later dollars reach worse ones. So ranking channels by average ROAS and giving the winner more money often puts the budget exactly where it returns least.
A worked example with three channels
Sample data: revenue in each channel follows revenue = a × spend^b, with spend in thousands of dollars and an exponent b below 1, which means diminishing returns. The curves are assumed for the example; in practice you fit them from your own history.
| Channel | a | b | Spend now | Revenue | Average ROAS | Marginal ROAS (next $1,000) |
|---|---|---|---|---|---|---|
| Search | 10.0 | 0.55 | $8,000 | $31,383 | 3.92 | 2.10 |
| Social | 6.0 | 0.75 | $6,000 | $23,002 | 3.83 | 2.82 |
| Display | 3.0 | 0.90 | $4,000 | $10,447 | 2.61 | 2.32 |
| Total | $18,000 | $64,832 | 3.60 |
Check one row: search revenue at $8,000 is 10 × 8^0.55 = 10 × 3.138 = $31,383, so average ROAS is 31,383 ÷ 8,000 = 3.92. At $9,000 revenue is 10 × 9^0.55 = $33,484, so the next $1,000 returns 33,484 − 31,383 = $2,101, a marginal ROAS of 2.10.
Search has the best average ROAS (3.92) and the lowest marginal ROAS (2.10). Social has a slightly lower average and the highest marginal (2.82). The ranking flips depending on the question you ask.
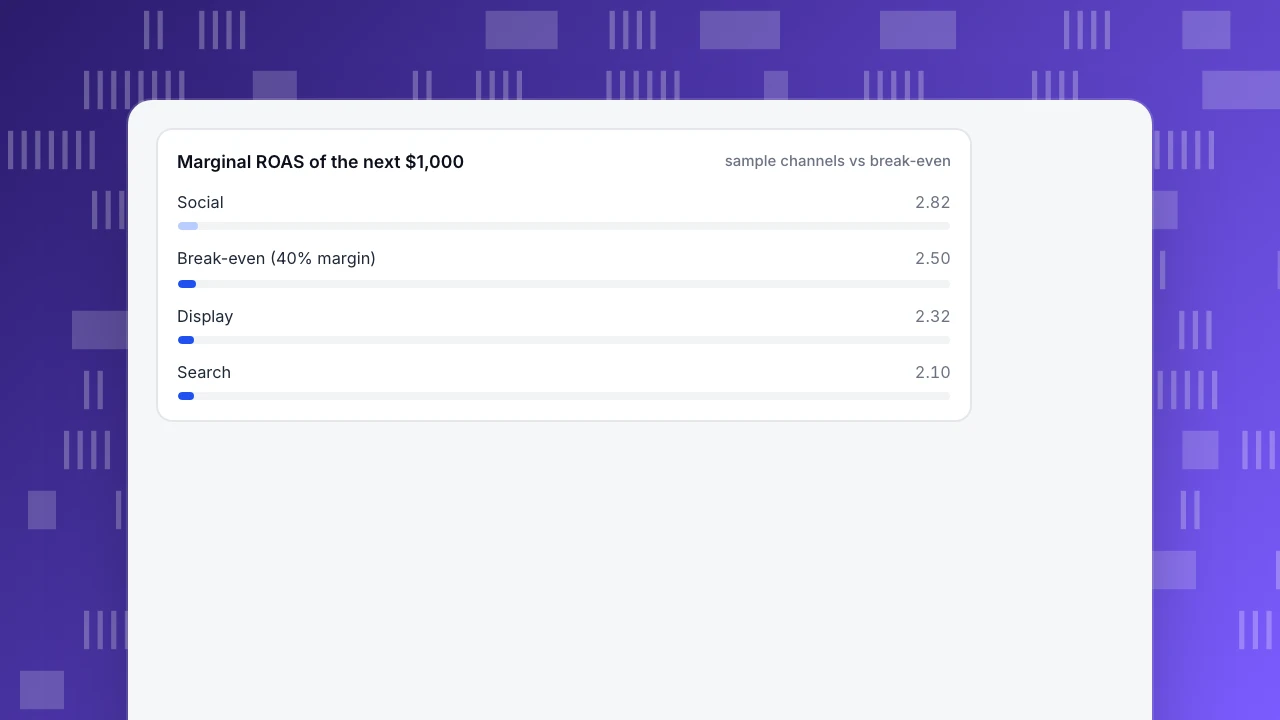
Marginal ROAS of the next $1,000
sample channels vs break-evenCompare marginal ROAS with break-even ROAS
A marginal ROAS is only good or bad against what the sale is worth. Break-even ROAS = 1 ÷ gross margin. At a 40% gross margin it is 1 ÷ 0.40 = 2.5: each $1 of spend must bring $2.50 of revenue to cover the product cost and the spend.
| Channel | Marginal ROAS | Break-even | Profit on the next $1,000 |
|---|---|---|---|
| Search | 2.10 | 2.5 | −$160 |
| Social | 2.82 | 2.5 | +$128 |
| Display | 2.32 | 2.5 | −$71 |
The profit column is marginal revenue × 40% − $1,000: for search, 2,101 × 0.40 − 1,000 = −$160. At current spend, only social is still paying for itself at the margin. Search and display look healthy on average and lose money on the last thousand dollars.
Reallocate in the direction of marginal return
Move budget from low marginal return to higher marginal return, keeping the total fixed. Sample data: shift $2,000 from search to social and $1,000 from display to social.
| Channel | Before | After | Revenue before | Revenue after |
|---|---|---|---|---|
| Search | $8,000 | $6,000 | $31,383 | $26,791 |
| Social | $6,000 | $9,000 | $23,002 | $31,177 |
| Display | $4,000 | $3,000 | $10,447 | $8,064 |
| Total | $18,000 | $18,000 | $64,832 | $66,031 |
Revenue rises by $1,199 on the same $18,000. After deducting product cost at a 40% margin and the spend, profit rises from $7,933 to $8,412, an extra $479. Marginal ROAS after the move is 2.37 for search, 2.56 for social and 2.38 for display: much closer together, which is the sign you are near a good allocation. Further moves would give smaller gains.
| Channel | Before | After | Revenue before | Revenue after |
|---|---|---|---|---|
| Search | $8,000 | $6,000 | $31,383 | $26,791 |
| Social | $6,000 | $9,000 | $23,002 | $31,177 |
| Display | $4,000 | $3,000 | $10,447 | $8,064 |
| Total | $18,000 | $18,000 | $64,832 | $66,031 |
Sample data: assumed response curves; the same $18,000 returns $1,199 more revenue.
Guardrails that keep this from going wrong
Optimising on one number can hurt the business, so set limits before you move money.
- Move in steps. Shift 10–20% of a channel's budget at a time and re-measure; do not move half the budget in one go.
- Keep floors. Brand and always-on channels need a minimum, or you lose the base that feeds the rest.
- Reserve a test budget. Hold about 10% for new channels, which will look worse at first because they have no history.
- Enough data. Google Ads cites at least 15 conversions in the last 30 days for Target ROAS on Search and Shopping. A channel with fewer conversions than that has a noisy ROAS; widen the window.
- Account for seasonality. Compare like with like periods, not a December channel against a January one.
Check that the curves are real
Attribution can over- or under-credit a channel, so test the biggest move with a holdout. Pause or reduce one channel in a few matched regions for 4 weeks and compare with comparable regions.
Sample data: social spend is paused in regions that normally take $1,200 of the monthly $6,000. Revenue in those regions falls by $3,900 compared with matched regions. Incremental ROAS = 3,900 ÷ 1,200 = 3.25. The reported average was 3.83, so reporting overstated the channel by about 15% (3.25 ÷ 3.83 = 0.85). The channel is still above break-even, so the plan holds; a result below 2.5 would have reversed it. Use incremental ROAS, not reported ROAS, for the biggest decisions.
Estimate marginal ROAS with a 10% step test
You will not have a clean curve for every channel, so measure the marginal return directly. Raise a channel's budget by 10% for two full weeks, hold everything else steady and compare revenue with the weeks before. Sample data: search spend rises 10% from $8,000 to $8,800 a month-equivalent and revenue rises from $31,383 to $33,072. Extra revenue is $1,689 on $800 of extra spend, so marginal ROAS = 1,689 ÷ 800 = 2.11, close to the 2.10 the curve gave. Do the same with a 10% cut when you want to see what you would lose. Two steps in opposite directions give a more reliable slope than one.
When channels overlap
Average ROAS ranks channels as if each one worked alone, but they feed each other. Social often starts journeys that search finishes, so last-touch reports give search the credit and social almost none. If you cut the channel that starts journeys, the finishing channel's revenue falls later and the cause is hard to see. Before you cut, look at the channel under several attribution models: a channel that loses badly under last touch but does well under first touch or linear is a starter, and the holdout test above is the way to size its true contribution.
A monthly routine
- Update spend and revenue per channel for the last 3 to 6 months.
- Estimate marginal ROAS from the change between spend levels, not from the average.
- Compare with break-even ROAS and mark channels above and below.
- Move a 10–20% slice from the lowest to the highest marginal return.
- Note the date and re-measure after one full cycle.
In TapCub
Use TapCub to supply the numbers the routine needs.
- Import spend by day, channel, source and campaign in All-platform analytics › Business › Channel ROI, as a CSV or entry by entry. The page shows cost per click, cost per acquisition and return on ad spend, grouped by channel, source or campaign.
- Open All-platform analytics › Behavior › Behavior analysis and choose attribution with several models side by side, so channels that mostly assist stand out before you cut them. The lookback window defaults to 30 days.
- Mark the date you changed a budget in Configuration › Annotations, so a later chart shows the change next to the result.
- Recognised bots are counted separately, so they do not inflate sessions or dilute conversion.
TapCub does not move budgets, set bids or run holdout tests. It reports the result and you decide the move; the sample curves above are assumptions, not something TapCub fits for you.
FAQ
What is marketing budget optimization?
It is moving a fixed budget between channels so the next dollar goes where it returns the most. The decision depends on marginal return, not on which channel has the best average return.
How do I decide how to allocate a marketing budget?
Estimate each channel's marginal ROAS, compare it with break-even ROAS (1 ÷ gross margin), and move a small slice from channels below break-even to those above. Re-measure after a full cycle.
What is marginal ROAS?
It is the extra revenue divided by the extra spend for the next increment. In the sample, search averages 3.92 but returns only 2.10 on the next $1,000.
How much should I spend on each channel?
There is no fixed split. Gartner's 2025 survey shows paid media at about 30.6% of marketing budgets, but your split should follow marginal return, with floors for brand and about 10% for tests.
How do I know ROAS numbers are right?
Run a holdout: pause a channel in matched regions for four weeks and compare incremental revenue with spend saved. In the sample, incremental ROAS was 3.25 against 3.83 reported.
Sources
- Gartner, 2025 CMO Spend Survey: marketing budgets have flatlined at 7.7% of overall company revenue (402 leaders; paid media about 30.6% of budgets), 12 May 2025. Checked 2026-11-21.
- Google Ads Help, About Target ROAS bidding (conversion thresholds: at least 15 conversions in 30 days for Search and Shopping). Checked 2026-11-21.
Was this article helpful?
We use your answers to fix and expand this page.
Couldn’t send. Please try again in a minute.
Thanks for the feedback. We’ll use it to improve this page.You’ve already sent feedback on this page. Thanks.

Product Adoption Consultant
Explores customer onboarding, live conversations, and self-service, turning common usage questions into practical guidance and improvements.