Try it on your own data
Every report in this article is in the free plan. One snippet for web and apps, up to 10 sites.
Start freeMobile ad fraud is activity that makes a campaign report clicks, installs or in-app events that did not come from genuine users. You detect it by comparing each source with a reference on click-to-install time, click-to-install rate, timestamp order, retention and concentration. In the sample below the source with the best-looking conversion rate has the worst next-day retention, which is why one headline metric is never enough.
What you will learn
- Compare every source with your own reference; no vendor publishes a universal cut-off in seconds
- Read click-to-install rate next to retention: injected installs convert well and never come back
- TapCub is not an attribution provider; it shows what installed users and landing-page visitors do afterwards
What is mobile ad fraud?
Mobile ad fraud is any activity that makes a mobile ad campaign report clicks, installs or events that did not come from a real person with real interest, so that someone gets paid or credited for it. Google Ads describes the general category as invalid clicks: clicks that do not represent genuine interest, including bots and other automated tools, accidental clicks and manual clicks made to raise costs or boost publisher profits (Google Ads Help, checked 2026-11-21). On mobile the money usually moves through installs and in-app events, which is why mobile fraud looks different from desktop click fraud.
The industry standard for measuring it splits the problem in two. The Media Rating Council separates general invalid traffic, caught by routine filtering such as known bots, crawlers and non-browser user agents, from sophisticated invalid traffic, which needs analysis beyond lists because it imitates real behaviour (MRC Invalid Traffic Detection and Filtration Guidelines addendum, announced October 2015). Most of this article is about the sophisticated half, because the simple half is already filtered by your ad partners.
One boundary first. TapCub does not match ad clicks to installs and is not an attribution provider, so it does not detect install fraud at the click. What it does is report what installed users do afterwards, which is where fraud leaves the clearest evidence. The step-by-step use is further down.
What are the main types of mobile ad fraud?
| Type | How it works | Where it shows up |
|---|---|---|
| Click injection (Android) | Malware on the device detects that an app install has begun and fires a fake click just before it finishes, to claim credit | Installs with click-to-install time of seconds; click arrives after install start |
| Click spamming or flooding | Huge volumes of clicks sent regardless of intent, hoping some users install later and get credited | Enormous click counts, very low click-to-install rate, long delays between click and install |
| Bots and install farms | Scripted or manual devices install and open apps to trigger paid installs | Installs with no further activity, clustered devices or IPs, night-time bursts |
| SDK spoofing | Fake install and event messages sent to the measurement service without a real device | Events with no matching session, impossible device or version combinations |
| Fake in-app events | Real installs followed by scripted purchases or levels to trigger cost-per-event payouts | Event counts far above normal for the cohort, with no later retention |
| Domain or app spoofing | The ad is shown in a different, low-quality app or site than the one reported | Placement reports that do not match where users actually came from |
For the human-run end of the spectrum, see bot farm. A single metric rarely identifies a type, which is why the next section combines several signals.
| Type | How it works | Where it shows up |
|---|---|---|
| Click injection | Fake click fired as an Android install begins | Click-to-install time of seconds |
| Click spamming | Huge click volume, hoping for later installs | Very low click-to-install rate, late installs |
| Bots and install farms | Scripted devices install and open apps | No later activity, clustered devices |
| SDK spoofing | Fake install messages with no device | Events with no session |
| Fake in-app events | Scripted purchases for per-event payouts | Event counts far above normal, no retention |
A single metric rarely identifies the type; combine two or three signals.
Which signals expose fraud in install and click data?
Five signals do most of the work. Each is a comparison against your own normal, not a universal threshold; the measurement vendors that publish click-injection documentation describe the logic, not a cut-off in seconds.
- Click-to-install time (CTIT) distribution. The time between click and first open. Plot the share of installs in time buckets for each source. Real installs spread out: a few seconds for instant installs, minutes for most, hours for people who click and come back. Click injection produces a spike in the first few seconds. Click spamming produces a long, flat tail of installs hours or days after the click. See click-to-install time.
- Click-to-install rate. Installs ÷ clicks for each source. A source with a very high click count and a rate far below your other sources is sending clicks nobody acted on.
- Timestamp order. On Android, the store reports when the install began. A click recorded after that moment cannot have caused it. Google's Play Install Referrer API returns both the referrer click time (
referrerClickTimestampSeconds) and the install begin time (installBeginTimestampSeconds) (Android Developers, checked 2026-11-21), and measurement vendors such as Adjust describe rejecting engagements that arrive after those timestamps. The check applies to Android only. - Post-install behaviour. Next-day retention, sessions, key events per install. Fraudulent installs rarely come back or do anything.
- Concentration. Many installs from the same device model, OS version, IP range or hour of the night.
What does a worked example look like?
Sample data: three sources each delivered 1,000 installs last week. We bucket click-to-install time and compare click-to-install rate and next-day retention.
| Click-to-install time | Source A | Source B | Source C |
|---|---|---|---|
| Under 10 seconds | 20 (2.0%) | 380 (38.0%) | 5 (0.5%) |
| 10–60 seconds | 140 (14.0%) | 220 (22.0%) | 15 (1.5%) |
| 1–10 minutes | 460 (46.0%) | 210 (21.0%) | 70 (7.0%) |
| 10 minutes–1 hour | 240 (24.0%) | 110 (11.0%) | 140 (14.0%) |
| 1–24 hours | 110 (11.0%) | 60 (6.0%) | 410 (41.0%) |
| Over 24 hours | 30 (3.0%) | 20 (2.0%) | 360 (36.0%) |
| Clicks | 60,000 | 45,000 | 2,500,000 |
| Click-to-install rate | 1.67% | 2.22% | 0.04% |
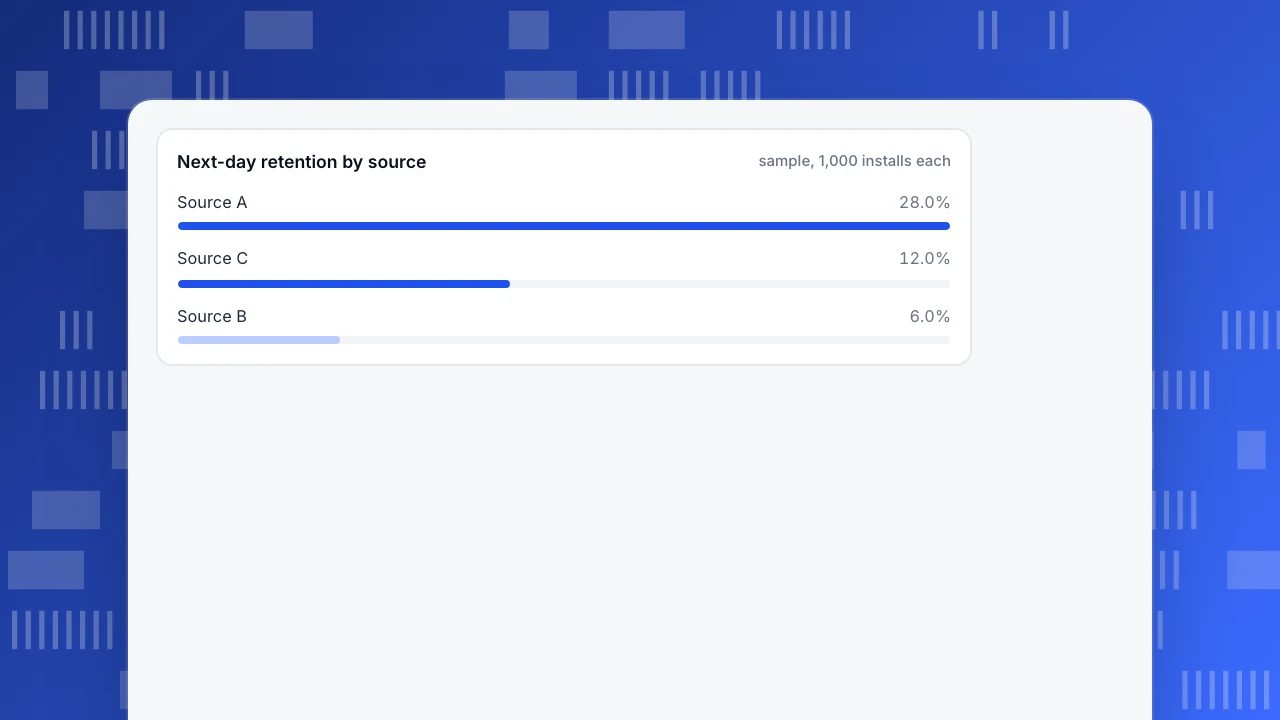
| Next-day retention | 28.0% | 6.0% | 12.0% |
How to recompute: each column adds to 1,000; shares are bucket ÷ 1,000; click-to-install rate is 1,000 ÷ clicks (60,000 gives 1.67%, 2,500,000 gives 0.04%); next-day retention is returning ÷ 1,000.
How to read it. Source A is the reference: most installs between one minute and an hour, 2% under 10 seconds, retention of 28.0%. Source B has 38.0% of installs under 10 seconds, nineteen times Source A's share, a click-to-install rate that looks great at 2.22% and retention of 6.0%. That combination fits click injection: the click arrives just before the install completes, so the rate looks excellent and the people never return. Source C has the opposite shape, 77% of installs more than an hour after the click, and a click-to-install rate of 0.04% on 2.5 million clicks. That pattern fits click spamming: the volume is enormous, and the few installs it is credited with are people who would probably have installed anyway. Its 12.0% retention reflects organic users who would have installed anyway.
The pattern to remember: B looks best on rate and worst on retention. A single headline metric would have picked B.
Next-day retention by source
sample, 1,000 installs eachHow should you act on a suspicious source?
Use a rule you can explain to the partner:
- Flag a source when two or more signals fall outside your reference source by a wide margin, for example under-10-second share above several times your reference and next-day retention below half of it. Write the thresholds down; they are yours, not an industry standard.
- Ask for the raw data. Request click and install timestamps and publisher or sub-publisher IDs for the flagged installs. Fraud is usually concentrated in a few sub-sources, so cutting the whole partner is often unnecessary.
- Check your contract. Most agreements define invalid traffic and a dispute window. Check it before the window closes, because credit is a negotiation about evidence, not about suspicion.
- Block narrowly. Exclude the sub-source, not the network, and turn on the click-injection filter in your measurement vendor if you use one.
- Re-measure. Compare the flagged source with itself after the change. Fraud shifts; a source that cleans up may be replaced by another that does not.
Google's own approach shows the principle: invalid clicks are filtered from reporting and billing automatically, and if some are found after you were billed, a credit may be applied to a later invoice where appropriate (Google Ads Help, checked 2026-11-21). The exact process differs by platform, but the shape is the same: evidence first, adjustment second.
How do you check this with TapCub?
TapCub does not match clicks to installs and is not an attribution provider, so the click-to-install timing belongs to your measurement vendor. TapCub's part is what happens after the install and what happens on the landing page.
- In App analytics › Users › Channels compare channels (the
$channelvalue your SDK stores) on average daily new users and next-day retention. A channel that is large but has very low retention is Source B in the example. The matrix plots new users against retention to make this visible. - If your measurement vendor sends install data to TapCub, App analytics › Quality & attribution › Attribution splits installs into organic, non-organic and unattributed. Compare that split with the channel retention above.
- For web and mobile-web campaigns, open Web analytics › Sources and read the UTM tab. Compare the clicks your ad platform reports with the sessions you actually received for the same campaign; a large gap means clicks that never became visits.
- Check Web analytics › Bots. TapCub counts recognised bots in their own report, so they do not inflate human visitor numbers and conversion rates. A spike there points to automated traffic.
- For a suspicious campaign, use All-platform analytics › Behavior › Behavior analysis to run a retention view for the people who arrived in that campaign and compare it with your reference.
TapCub measures; it does not block traffic or ask for refunds. The decision to cut a source stays with you and your partner agreement.
What mistakes undermine fraud detection?
- Using one threshold for all sources. Instant-install sources legitimately have shorter times. Compare each source with your own reference.
- Trusting the headline rate. Source B's 2.22% looks better than Source A's 1.67%. Always read rate next to retention.
- Acting on small samples. Under about 200 installs per source, bucket shares swing by several points on chance alone.
- Ignoring organic. Click spamming steals organic installs, so a paid source can look good while true organic volume falls. Watch organic installs too.
- Cutting the whole partner. Fraud is usually in a few sub-publishers.
FAQ
What is mobile ad fraud?
Mobile ad fraud is activity that makes a campaign report clicks, installs or in-app events that did not come from genuine users, so that a publisher or network is paid or credited. Common types are click injection, click spamming, bots and install farms, SDK spoofing and fake in-app events.
How can you detect mobile ad fraud?
Compare each traffic source with a reference on click-to-install time distribution, click-to-install rate, timestamp order, next-day retention and concentration by device or IP. No single signal is proof, but two or three out of line together are a strong reason to ask for raw data.
What is click injection?
On Android, malware detects that an app install has started and sends a fake click just before it finishes so the fraudster gets last-click credit. Vendors detect it by comparing the click with the install-begin time from the store; a click recorded after that moment is rejected.
What is the difference between click injection and click spamming?
Click injection fires one fake click at the right moment, so installs show a spike of very short click-to-install times. Click spamming sends enormous numbers of clicks and waits, so installs show a long tail of late installs and a very low click-to-install rate.
Can an analytics tool detect ad fraud?
An analytics tool can show what installs and visitors do afterwards, such as retention, events and bot share, which exposes low-quality traffic. Detecting a fake click at install time needs the measurement vendor that matches clicks to installs.
Sources
Was this article helpful?
We use your answers to fix and expand this page.
Couldn’t send. Please try again in a minute.
Thanks for the feedback. We’ll use it to improve this page.You’ve already sent feedback on this page. Thanks.

Data Engineer
Writes about event design, data quality, and collection workflows, with verifiable implementation methods for reliable analytics.