Try it on your own data
Every report in this article is in the free plan. One snippet for web and apps, up to 10 sites.
Start freeMobile app monitoring tools fall into five categories: crash reporting, performance monitoring, store and OS vitals, usage analytics and session replay. Each sees a different part of the app, so no single tool covers all of it. Pick by the question you need answered, and know whether a crash rate counts users or sessions.
What you will learn
- Five categories see different things; crash reporting alone cannot tell you whether the new release lost users
- With the same crashes, crash-free users was 98.5% and crash-free sessions 99.4%; always check the denominator
- A blended 1.50% crash rate hid version 4.3 at 2.80%, 2.6 times worse than version 4.2
Monitoring and analytics answer different questions
App monitoring answers "is the app healthy right now": is it crashing, is it slow, is it using too much battery or memory. Product analytics answers "what are people doing and did a change help": events, funnels, retention. You need both, because a healthy app can still lose users at a bad onboarding screen, and a well-designed app can still crash on one device model.
The tools overlap, which makes shopping confusing. A useful way to cut through it is to ask which of these five questions you cannot answer today:
- Is the app crashing, and for whom?
- Is it slow, and where?
- How does the platform judge it?
- What do users do, and did the last release change it?
- What did one user's session look like?
Five categories and what each sees
| Category | What it measures | What it cannot see | Typical metric |
|---|---|---|---|
| Crash and error reporting | Crashes, ANRs, handled errors with stack traces | Whether people left because of slowness | Crash-free users or sessions |
| Performance monitoring | Start time, slow frames, network calls, memory | Why a user behaves differently | Cold start median, slow rendering share |
| Store and OS vitals | Platform-level crash, ANR, battery, memory | Business events and funnels | User-perceived crash rate vs threshold |
| Usage analytics | Who does what: events, funnels, retention, versions | Root cause of a crash | Active users, retention, crash-free users by version |
| Session replay | What one session looked like | Aggregate rates | Replays of a crashed session |
Three practical notes:
- Store vitals are free and already collecting. Android vitals in Play Console and the Xcode Organizer and MetricKit on Apple platforms are fed by the operating system, so they see events an SDK misses, such as crashes before the SDK starts.
- A crash reporter and an analytics tool answer different questions even when both show a crash rate. One is for fixing the bug, the other for judging the damage.
- Replay explains one case; it does not size a problem. Use rates to decide what matters and replay to see it.
| Category | What it measures | What it cannot see | Typical metric |
|---|---|---|---|
| Crash and error reporting | Crashes, ANRs, handled errors with stack traces | Whether people left because of slowness | Crash-free users or sessions |
| Performance monitoring | Start time, slow frames, network calls, memory | Why a user behaves differently | Cold start median, slow rendering share |
| Store and OS vitals | Platform-level crash, ANR, battery, memory | Business events and funnels | User-perceived crash rate vs threshold |
| Usage analytics | Who does what: events, funnels, retention, versions | Root cause of a crash | Active users, retention, crash-free users by version |
| Session replay | What one session looked like | Aggregate rates | Replays of a crashed session |
Categories describe what each kind of tool is built to see; many products cover two or three of them. No tool is ranked here.
Crash-free rate: count users or sessions
Crash-free metrics look the same and are not. Firebase Crashlytics defines two:
- Crash-free users = 1 − crashed users ÷ all users
- Crash-free sessions = 1 − crashed sessions ÷ all sessions
Sample data: 20,000 daily users, 60,000 sessions in the day (3 each on average). 300 users saw at least one crash, and there were 360 crashed sessions.
- Crash-free users = 1 − 300 ÷ 20,000 = 98.5%
- Crash-free sessions = 1 − 360 ÷ 60,000 = 99.4%
Same crashes, a 0.9-point difference. The user measure is harsher because one unlucky user counts once however many sessions they started. Crashlytics also notes that a longer period gives users more chances to crash, so crash-free users for a week is not comparable with one for a day.
Android's documentation shows the same effect between tools. Android vitals shows issues per daily active user, whereas Crashlytics counts per app session. If a user played a game three times in a day and crashed once, Android vitals would show a 100% crash rate for that user while Crashlytics would show 33%. Android vitals also includes crashes that happen before an SDK initialises and only counts devices that share data and apps installed from Google Play, so numbers from the two will not match exactly.
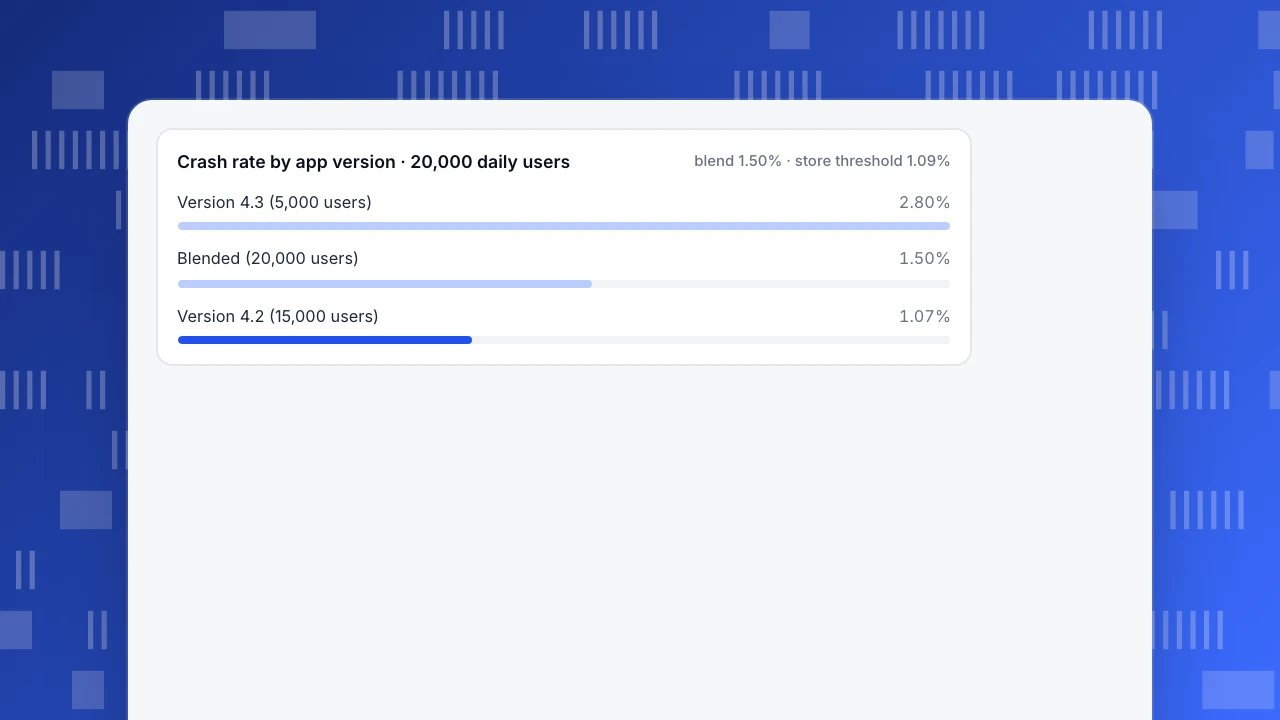
Crash rate by app version · 20,000 daily users
blend 1.50% · store threshold 1.09%A blended rate can hide one bad release
Take the 300 crashed users from above and split them by version. Sample data: version 4.3 is rolling out and has 5,000 daily users; version 4.2 has 15,000.
| Version | Daily users | Crashed users | Crash rate | Crash-free users |
|---|---|---|---|---|
| 4.2 | 15,000 | 160 | 1.07% | 98.93% |
| 4.3 | 5,000 | 140 | 2.80% | 97.20% |
| All | 20,000 | 300 | 1.50% | 98.50% |
The blend says 1.50%, which looks like a modest problem everywhere. The split says 4.3 crashes 2.6 times as often as 4.2 (2.80 ÷ 1.07). The right action is to halt the rollout of 4.3 and look at its error groups, not to spread effort across the app. Always read stability by version and by device model.
What the platform thresholds say
Android vitals publishes the levels at which Google Play may reduce an app's visibility or show a warning. Over a 28-day window the overall bad-behavior thresholds are 1.09% for user-perceived crash rate and 0.47% for user-perceived ANR rate, and 8% per phone model for both. Play checks daily against a 28-day average and flags emerging issues for crashes and ANRs that affect devices for more than 7 days, which gives you 21 days to act.
In the example, the blended 1.50% is above the 1.09% line. That is a warning for the whole app, even though 4.2 on its own (1.07%) is just under it. The numbers are not an exact match, because Android vitals counts only user-perceived crashes, but the direction is clear: fix 4.3 before the 28-day average catches up.
Do not copy the threshold to iOS. Apple provides its own crash and diagnostic data through Xcode Organizer and MetricKit; use those figures there.
How to choose what you need
Use these rules:
- Only a crash rate needed? Start with the store consoles and whatever your SDKs already report. They are free.
- Need stack traces and grouping? Add a crash reporter for fixing bugs.
- Slow starts or janky screens? Add performance sampling and watch cold-start median and freezes.
- Cannot say if a release hurt retention? Add usage analytics with a version dimension.
- One user's complaint you cannot reproduce? Use session replay for that one case.
- Do not buy five tools. Choose the one question you cannot answer, then check what each candidate says it cannot see.
A monitoring starter plan for the first 30 days
You do not need every category on day one. Add them in the order the questions arise.
| When | Add | Alert on |
|---|---|---|
| Before launch | Store consoles (already collecting), crash reporting, version and device model on every event | Nothing yet; check that crashes arrive |
| Launch week | Crash-free users by version, cold start median | Crash users above 75% of the platform threshold on a version with 1,000 or more daily users |
| Weeks 2 to 4 | Retention by version, ANR and freeze counts | Crash users rising two days in a row |
| After the first update | Per-version comparison for every release | New version worse than the previous one |
Why 75%? Android vitals' overall crash threshold is 1.09%, and 75% of it is about 0.82%. Play judges against a 28-day average and flags emerging issues, which gives you 21 days after the 7-day detection to fix them. An alert at 0.82% on one version leaves time to halt a rollout before the 28-day average crosses the line.
Why 1,000 daily users? With fewer, one crashed user moves the rate by more than 0.1 point (1 ÷ 1,000 = 0.1%), so a single crash would fire the alert. For a smaller app, alert on counts, such as five crashed users on one version in a day, rather than on a rate.
Three habits keep the plan cheap:
- One owner per alert. An alert with no owner becomes noise within a month.
- Always tag events with the app version. Without it, every graph above is a blend.
- Review the thresholds after each major release, because a new feature changes what normal looks like.
Mistakes when setting up app monitoring
- Comparing numbers from two tools. A store console counts per daily active user and an SDK tool per session, so one will always look better. Pick one for decisions and quote its definition.
- Reading crash-free over different windows. A 7-day crash-free users figure is lower than a 1-day figure for the same app, because users have more chances to crash.
- Ignoring versions. Without a version on each event, a bad release is averaged into the whole user base for weeks.
- Alerting on everything. Five alerts that someone owns beat fifty that nobody reads.
- Assuming the SDK captures crashes by itself. Check that a crash event arrives from a deliberate test crash on a debug build before you trust a flat line.
- Treating ANRs and freezes as crashes. They are different problems with different fixes: a blocked main thread, not a thrown exception.
The cheapest improvement is a test crash in every release candidate. If it does not show up on the dashboard within minutes, the monitoring is not working, however good the tool.
How to read app health in TapCub
Use the version example above.
- Open App analytics › Quality & attribution › Stability. The crash-free share shown is 1 − crash users ÷ active users, the user measure, next to crash count, ANRs, UI freezes, starts and the median cold start, hot start and memory. On Android an ANR means the main thread was blocked for at least 5 seconds; on iOS and HarmonyOS a UI freeze means 2 seconds.
- Check App analytics › Users › Versions (versions and channels) to see crash counts per version, as in the 4.2 vs 4.3 table. Filter other reports by version in the header.
- In the error groups, filter by active, resolved or ignored, and change a group's status once someone owns it.
- Check the SDK page for your platform: not every SDK reports crashes by itself, so confirm the
$app_crashedevent is arriving before you trust a flat line. If the page says no data yet, an editor can click Recompute (last 7 days). - Use App analytics › Users › Retention to see whether people on the new version come back as often as people on the old one.
The stability page shows crashes, ANRs, freezes, start time and memory. It does not show backend traces or request timing, so keep your server-side tracing separate.
FAQ
What are mobile app monitoring tools?
They are tools that collect data about how an app behaves on real devices: crashes, errors, speed, memory and sometimes usage. Different types cover different questions, so most teams combine store consoles with one or two others.
What is a good crash-free rate?
Compare with the platform threshold and your own previous version. Android vitals' bad-behavior line is 1.09% user-perceived crash rate overall, about 98.9% crash-free. A rate that is worse than your last release matters more than a generic target.
What is the difference between crash-free users and crash-free sessions?
Crash-free users divides by users; crash-free sessions divides by sessions. With the same crashes users is lower, 98.5% against 99.4% in the example. Use one measure consistently and say which.
What is an ANR?
ANR means "application not responding" on Android: the main thread is blocked long enough that the system treats the app as frozen. In TapCub's stability page it means blocked for at least 5 seconds.
Do I need both monitoring and analytics?
Usually yes. Monitoring tells you whether the app is healthy; analytics tells you whether people stay and whether a release helped. Use the version dimension to connect them.
Sources
Was this article helpful?
We use your answers to fix and expand this page.
Couldn’t send. Please try again in a minute.
Thanks for the feedback. We’ll use it to improve this page.You’ve already sent feedback on this page. Thanks.

Data Analyst
Explores traffic sources, conversion funnels, and retention, using clear metric definitions and concrete examples to explain what the numbers mean.