Try it on your own data
Every report in this article is in the free plan. One snippet for web and apps, up to 10 sites.
Start freeMobile app UX design works when people finish the task they came for without friction, and a design decision stays a hypothesis until usage data checks it. Pair each principle with a metric: fewer steps with funnel conversion, stability with crash rate, a clear first run with retention. In the sample signup flow, one screen, the permission prompt, caused 50.1% of all losses; moving it later was forecast to lift completion from 32.1% to 37.5%.
What you will learn
- Choose the principle from the funnel's largest absolute loss, then write the metric you will check after release
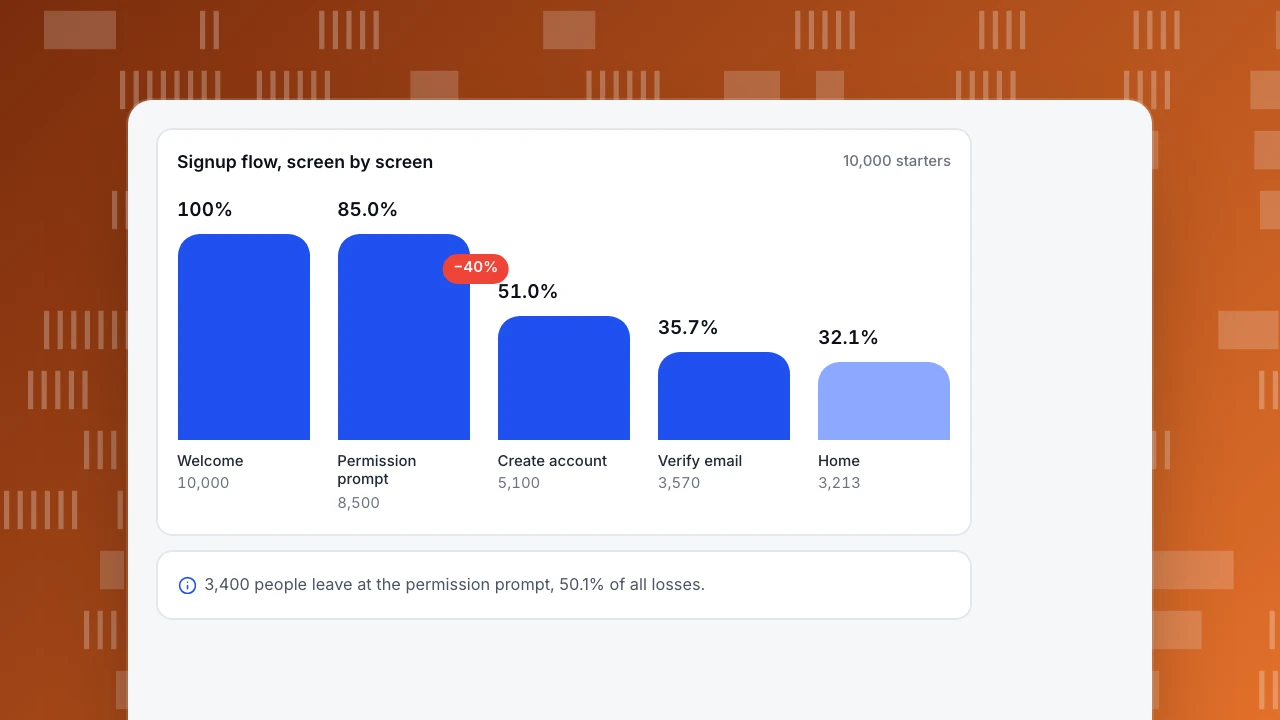
- In the sample, the permission prompt lost 3,400 of 6,787 people (50.1%); moving it later forecasts +16.7% reaching Home
- Fix stability first: Google Play flags 1.09% of daily users with a crash or 0.47% with an ANR
What makes mobile app UX design work, and how do you know?
Mobile app UX design is the design of how a person gets something done on a small screen, with one hand, often interrupted. It works when people complete the task they came for, without friction they have to think about. The part most guides skip is the "how do you know": a design decision is a hypothesis until usage data confirms or rejects it.
That gives this guide its shape. For six common design principles you will see the decision, the metric that validates it, and the evidence. Then a worked example of a signup flow with the drop-off on each screen, a forecast of what fixing the worst screen is worth, and a section on what you can and cannot see in a native app. If you are optimising an app already in the store, mobile app optimization covers the broader programme, and UX metrics explains the measures.
Which design decisions can usage data check?
| Design principle | The decision | The metric that validates it | Typical evidence |
|---|---|---|---|
| Few steps in the key flow | Remove or merge screens between intent and goal | Step-to-step conversion in a funnel | The screen with the largest drop |
| Reachable, forgiving targets | Make tap areas large enough, spaced out | Repeated taps (rage taps), mis-tap events | Several fast taps in one spot |
| Fast and stable | Cut launch and screen load time; fix crashes first | Crash-free users, launch time, stability by version | Android bad-behavior thresholds |
| A clear first run | Show value before asking for an account | Day-1 and day-7 retention; first-session completion | Retention split by onboarding path |
| Predictable navigation | Same place, same name, same behaviour | Screen paths; back-and-forth between two screens | Loops between the same two screens |
| Helpful errors | Say what went wrong and how to fix it | Error events per screen; completion after an error | Users who retry vs leave after an error |
Two rules for using the table:
- Pick the principle from the data, not the other way round. Start from the funnel's largest drop and ask which principle explains it.
- Every fix needs a number you will check afterwards, written down before the release.
- Change one thing per release where you can. If a release moves the permission prompt, the form and the copy at once, you will see a change in the funnel and not know which edit caused it.
| Principle | Metric that validates it |
|---|---|
| Few steps in the key flow | Step-to-step funnel conversion |
| Reachable, forgiving targets | Repeated taps by screen |
| Fast and stable | Crash-free users, launch time, stability by version |
| A clear first run | Day-1 and day-7 retention |
| Predictable navigation | Screen paths and loops |
| Helpful errors | Error events and completion after an error |
Pick the principle from the data, then write the metric before the release.
Worked example: drop-off by screen in a signup flow
Sample data: 10,000 people open a new version and start the signup flow.
| Screen | People who reach it | Share of previous screen | Share of the 10,000 | Left on the previous screen |
|---|---|---|---|---|
| 1. Welcome | 10,000 | n/a | 100.0% | n/a |
| 2. Permission prompt | 8,500 | 85.0% | 85.0% | 1,500 |
| 3. Create account | 5,100 | 60.0% | 51.0% | 3,400 |
| 4. Verify email | 3,570 | 70.0% | 35.7% | 1,530 |
| 5. Home | 3,213 | 90.0% | 32.1% | 357 |
Checks: 8,500 × 0.60 = 5,100; 5,100 × 0.70 = 3,570; 3,570 × 0.90 = 3,213; overall 3,213 ÷ 10,000 = 32.1%. People lost across the flow: 1,500 + 3,400 + 1,530 + 357 = 6,787, of whom the 3,400 who leave at the permission prompt are 3,400 ÷ 6,787 = 50.1%.
Reading the table:
- The permission prompt is where the design is failing. 40% of the 8,500 people who see it never reach "Create account" (the row shows 60.0% reaching the next screen), and that single screen takes half of all losses. The welcome screen loses 15% and the create-account screen 30%.
- The percent-of-previous column finds the problem; the people column sizes it. The email step has the best conversion (90% reach Home) but only 357 people to save.
- Do not fix the step with the highest percentage drop alone. The rule is highest absolute loss × plausibility of a fix.
What the data cannot tell you is why. For that, put five people on the screen (Nielsen's model estimates five users find about 84% of the problems in a round) or watch a handful of real sessions.
Signup flow, screen by screen
10,000 startersWelcome
10,000
Permission prompt
8,500
Create account
5,100
Verify email
3,570
Home
3,213
What is a fix worth? A forecast before you build
Suppose the permission prompt is moved until after sign-up, once the person has seen what the app does (the "show value before asking" principle), and that lifts the share reaching "Create account" from 60.0% to 70.0%, with nothing else changing.
| Today | After the fix | |
|---|---|---|
| See the permission prompt | 8,500 | 8,500 |
| Reach Create account | 60.0% → 5,100 | 70.0% → 5,950 |
| Reach Verify email (70.0%) | 3,570 | 4,165 |
| Reach Home (90.0%) | 3,213 | 3,748.5 |
| Overall completion | 32.1% | 37.5% |
Gain: 3,748.5 ÷ 3,213 − 1 = +16.7% more people reaching Home (about 535 more per 10,000 starters). Treat this as a ceiling to compare options, not a promise: people pushed through a simpler form may verify their email at a lower rate than the people who got through before. Check the email step after release.
How big should tap targets be?
Touch targets are a design principle with published numbers, but be careful about which standard applies. The Web Content Accessibility Guidelines 2.2 set a minimum target size of 24 by 24 CSS pixels at Level AA (success criterion 2.5.8), with exceptions for spacing, and describe a larger 44 by 44 CSS pixel target in the enhanced criterion (2.5.5). Those numbers are for web content. Native iOS and Android guidelines publish their own minimums in their own units, so check the platform you build for and use the WCAG numbers only as a cross-check.
You can validate target size with data. If many sessions contain three or more taps within a second in the same spot, people are missing the target or the response is slow. Report the share of sessions with rapid repeated taps by screen, and compare before and after a change.
Is stability part of UX?
Yes, and it is the part that outranks every design principle. A crash cancels the task. Google's Play Console publishes bad-behavior thresholds: apps are flagged when 1.09% or more of daily users experience a user-perceived crash, or 0.47% or more a user-perceived ANR (app not responding), and the same measures apply per device model at 8%.
Use them as a check: if your crash rate by version is above 1.09%, fix that before you redesign a screen. And look at crashes by screen, not just overall; a crash on the payment screen costs more than the same count on a settings screen.
What can you actually see in a native app?
Be clear about what native-app analytics gives you:
- You can see: screen views and time on screen (from leave events), screen paths between adjacent screens in a session, funnels over events, custom events for taps you care about, retention, version, crashes and ANRs.
- You cannot see: click heatmaps of the kind that exist for web pages. Custom events for taps are the substitute.
So the validation routine for an app is:
- Funnel by screen to find the biggest absolute loss.
- Events on the controls around that screen (the button, the field, the error) to see what people tried.
- Version comparison to see whether the change helped on the new version only.
- A small usability test or session sample to learn why.
What does a release routine look like?
- Before release: write the metric and the target (for example, share reaching Create account from 60% to 70%).
- Release to everyone or a share, and keep the old and new versions separable in your reports.
- After release, compare the same window and the same population: new installs on the new version against new installs on the old version in the weeks before. Do not compare a holiday week to a normal week.
- Check the downstream step (the email step in the example) and crash rate on the new version.
- Record the result next to the original screen so the next redesign starts with evidence.
Measuring app UX design in TapCub
Take the signup flow above and measure it.
- Add the SDK (iOS, Android, Flutter, React Native or HarmonyOS) from App analytics › Configuration › SDK code. Report screens with the screen call; native apps need to call it themselves.
- In All-platform analytics › Behavior › Behavior analysis, build a funnel with the five screens or events and read step-to-step conversion; split by version to see the new design separately.
- In App analytics › Behavior › Screens & paths, read visits, people and average time on each screen and the flow between adjacent screens. Use App analytics › Behavior › Custom events for the taps on the permission prompt buttons.
- In App analytics › Users › Versions, compare adoption by version, and in App analytics › Quality & attribution › Stability, read crashes, ANRs and freezes.
- Use App analytics › Users › Retention to check whether people who completed the new flow come back.
TapCub has no click heatmaps or session replay for native apps; use custom events for taps, and use another tool or a usability test to learn why. It does not run experiments or split traffic; compare versions or periods instead.
FAQ
What are the principles of mobile app UX design?
Few steps in the key flow, reachable and forgiving tap targets, speed and stability, a clear first run, predictable navigation and helpful errors. Each can be checked with a metric such as funnel conversion or crash rate.
How do you validate a mobile app design?
Use funnels to find the screen with the biggest loss, events on the controls to see what people tried, version comparison to check the fix and a small test to learn why. Write the target before release.
What is a good tap target size?
WCAG 2.2 sets 24 by 24 CSS pixels at Level AA and 44 by 44 in the enhanced criterion, for web content. For native apps, follow the platform guidelines and check repeated-tap rates in your data.
Can I see heatmaps in a mobile app?
Not click heatmaps in the web sense with TapCub. Use screen paths, funnels and custom events on the controls that matter, plus recordings or usability tests elsewhere.
What crash rate is too high?
Google Play flags an app when 1.09% or more of daily users experience a user-perceived crash, or 0.47% an ANR. Fix stability before redesigning screens above those thresholds.
Sources
Was this article helpful?
We use your answers to fix and expand this page.
Couldn’t send. Please try again in a minute.
Thanks for the feedback. We’ll use it to improve this page.You’ve already sent feedback on this page. Thanks.

Product Experience Specialist
Writes about product experience, practical workflows, and growth, turning complex processes into clear steps for everyday decisions.