Try it on your own data
Every report in this article is in the free plan. One snippet for web and apps, up to 10 sites.
Start freeMobile web analytics measures visitors using your site in a phone browser; mobile app analytics measures people using your installed app. They differ in identity (browser identifier vs install identifier), session rules (30-minute inactivity timeout by default in GA4, and the same events can become 3 to 5 sessions depending on the timeout), available metrics (Core Web Vitals vs crash and version data) and fix speed (a deploy vs an app-store release).
What you will learn
- Never add web visitors and app users into one "users" number; with 1,200 matched out of 8,000 the overlap was 17.6% of real people
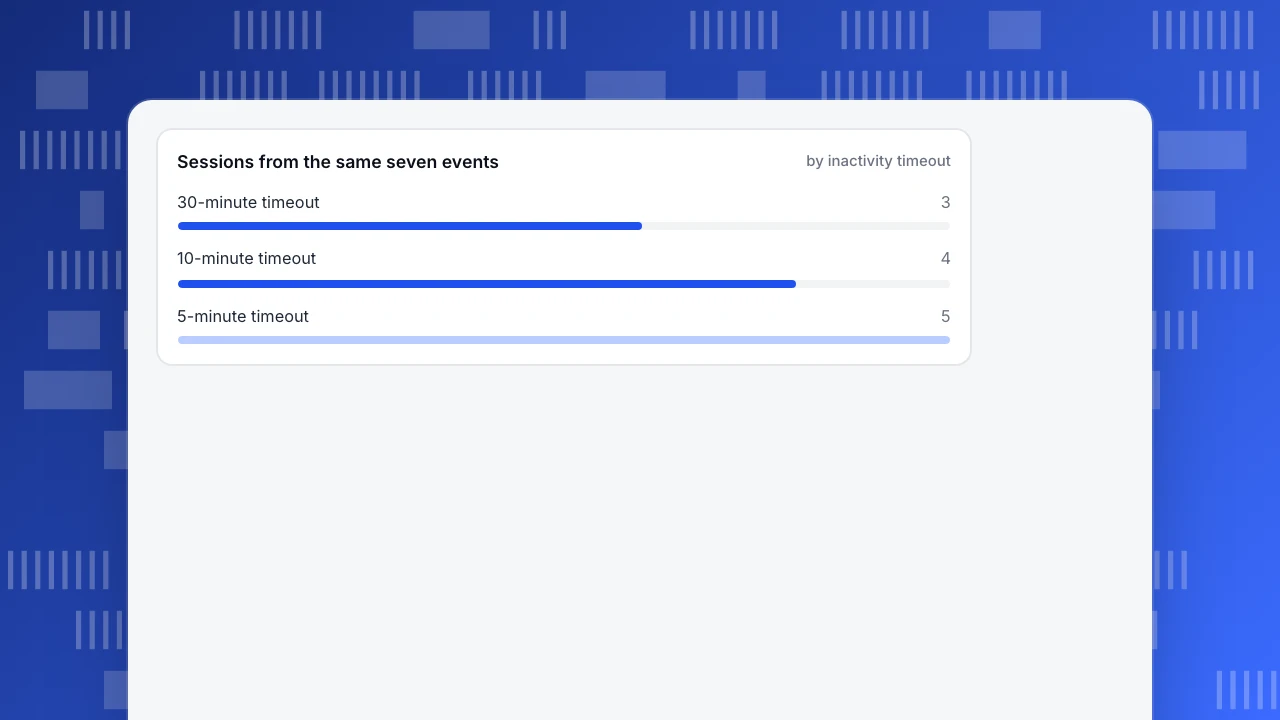
- Compare sessions only under the same timeout: the same seven events made 3, 4 or 5 sessions at 30, 10 and 5 minutes
- Read app quality by version: a fix on 62% of users still left a 0.96% blended crash rate
What is the difference between mobile web analytics and mobile app analytics?
Mobile web analytics measures people who use your website in a phone's browser. Mobile app analytics measures people who use your installed app. Both count visits, screens or pages and conversions, but they differ on four things that change what a number means: how a person is identified, where a session starts and ends, which metrics exist, and how quickly you can ship a fix.
The practical consequence is that the same person can be two "users" in your reports, a session in one environment is not a session in the other, and a drop in one is fixed in an afternoon while the other waits for an app-store release. This guide goes through each of the four differences with numbers, shows a session example you can recompute, and ends with a rule for when you need both. If you are choosing software for the app side, see mobile app analytics tools; the definition is in mobile app analytics.
Side by side: mobile web vs mobile app
| Dimension | Mobile web | Mobile app |
|---|---|---|
| Identity | A browser identifier on one browser on one device; resets when site data is cleared | An install-level identifier on one device; resets on reinstall |
| Unit of content | Page view (including route changes in single-page sites) | Screen view; custom events for taps |
| Session start | A page is viewed while no session is active | The app is opened in the foreground |
| Session end | Inactivity timeout (30 minutes by default in GA4) | Inactivity timeout (30 minutes by default in GA4); background time matters |
| Acquisition | Referrer, UTM tags, search | Store listing, install source, deep links, campaign tags in links |
| Performance signals | Core Web Vitals: LCP, INP, CLS | Launch time, crash rate, ANR (app not responding) rate |
| Quality threshold | LCP 2.5 s, INP 200 ms, CLS 0.1 at the 75th percentile | Android: 1.09% of daily users with a crash, 0.47% with an ANR flags bad behavior |
| Shipping a fix | Deploy; everyone has it on next load | Release; old versions stay in use for weeks |
| Click heatmaps | Possible (page layout is the same for everyone) | Not the same thing; screen paths and events instead |
The table is a map, not a ranking. Neither side is better; they answer different questions with different units. The rest of this guide explains the rows that cause the most mistakes.
| Question | Use |
|---|---|
| Does the content or landing page work? | Mobile web: sources, engagement, conversion, LCP and INP |
| Does the product hold users? | App: retention, version, crash and ANR rates |
| Do both serve the same people? | Both in one project with a shared sign-in identifier |
Engagement rate (engaged sessions ÷ sessions) is the most comparable number across both.
How does identity differ, and why does it double-count people?
A mobile web visitor is a browser on a device. An app user is an install on a device. If someone browses your site on their phone on Monday and installs the app on Thursday, your reports hold two identities for one person until something connects them, usually a login.
Sample data to show the size of the problem. A store counts 5,000 mobile web visitors and 3,000 app users in a month. 1,200 people used both and signed in on both.
- Added together, reports show 5,000 + 3,000 = 8,000 "users".
- With the 1,200 matched through login, distinct people are at most 8,000 − 1,200 = 6,800.
- The overlap you cannot see is 1,200 ÷ 6,800 = 17.6% of your real audience double-counted.
The 1,200 are the people you could match. Anyone who used both but never logged in is still counted twice, so 6,800 is an upper bound on distinct people, not an exact count.
Two rules follow. Never add web visitors and app users and call the result "users". Show them as two lines. And if you want a single view of people, you need a shared sign-in identifier; anonymous visitors cannot be merged across environments.
How do sessions differ? A worked example
In GA4, a session starts when a user opens your app in the foreground, or views a page or screen while no session is active, for example after a previous session timed out. The default timeout is 30 minutes of inactivity, and there is no limit on how long a session can last. Web timeouts can be changed in the data stream settings; app timeouts through an SDK call. Other tools use other defaults, which is why session counts from two tools rarely match.
Sample data: one person's activity, in minutes from the start of the day's first event.
| Event time (minutes) | 0 | 4 | 20 | 28 | 70 | 72 | 110 |
|---|---|---|---|---|---|---|---|
| Gap from previous event | 4 | 16 | 8 | 42 | 2 | 38 |
Now count sessions under three timeouts. A new session begins whenever the gap exceeds the timeout.
| Timeout | Gaps that exceed it | Sessions |
|---|---|---|
| 30 minutes | 42, 38 | 3 |
| 10 minutes | 16, 42, 38 | 4 |
| 5 minutes | 16, 8, 42, 38 | 5 |
The same seven events make 3, 4 or 5 sessions depending on one setting. That means:
- A mobile web vs app comparison of sessions is only fair if both use the same timeout.
- On a phone, people leave and return constantly (a message arrives, they switch apps), so short gaps are common. A short timeout inflates sessions per user; a long one hides separate visits.
- When two tools disagree on sessions by 10 to 20%, check the timeout before suspecting tracking.
Sessions from the same seven events
by inactivity timeoutWhich metrics exist on one side but not the other?
Some metrics are shared in meaning, some only exist in one environment.
- Shared idea: the engaged session. GA4 counts a session as engaged if it lasts longer than 10 seconds, has a key event, or has 2 or more page or screen views. Engagement rate is engaged sessions as a share of sessions, and bounce rate is the share of sessions that were not engaged. It works the same way on web and app, which makes it the most comparable number across both.
- Web only: referrer and landing page, page-level scroll depth, Core Web Vitals. A slow LCP on mobile web is a page problem you can fix with a deploy.
- App only: installs and uninstalls, app version, launches, crash and ANR rates, push-notification opens. Android's published thresholds flag an app when 1.09% or more of daily users experience a user-perceived crash, or 0.47% or more an ANR.
- Retention behaves differently. A web visitor who returns after 20 days may have cleared their browser data and look new. An app install keeps its identifier, so day-30 retention is more reliable on the app side.
Choose metrics per question: "does the content work?" uses engagement and conversion on both; "does the product hold users?" uses retention, which is cleaner in the app.
How do releases and tooling change what you can do?
On the web, you edit code and the next page load has the fix. In an app, a fix reaches users only when they update, so several versions are live at once. That is why app analytics has a version dimension that web mostly does not.
Sample data: a crash was fixed in version 3.2. The share of daily users per version and the crash-affected rate on each.
| Version | Share of daily users | Users with a crash |
|---|---|---|
| 3.2 | 62% | 0.6% |
| 3.1 | 25% | 1.4% |
| 3.0 | 13% | 1.8% |
| Blended | 100% | 0.96% |
Blended rate: 0.62 × 0.6% + 0.25 × 1.4% + 0.13 × 1.8% = 0.372 + 0.350 + 0.234 = 0.956%. The fix cut the rate to 0.6% on the new version, but 38% of daily users are still on old versions, so the overall rate only improves as they update. If you look at a single blended figure you will conclude "the fix did not work enough"; if you look by version you see that it did.
Tooling differs the same way: websites use a script tag and a server-side collection endpoint; apps use a software development kit (SDK) compiled into each release, and a change to what you track also waits for a release.
When do you need both?
| Your situation | What to measure | Why |
|---|---|---|
| Content or marketing site only | Mobile web | No app exists; focus on LCP, engagement, sources |
| App only (no meaningful website) | App analytics | Focus on version, retention, crash rate |
| App plus a website that drives installs and sign-ups | Both, in one project | Mobile web is where acquisition happens; app is where retention happens |
| Same logged-in users on both | Both, with a shared sign-in identifier | Otherwise you double-count (17.6% in the example) |
If the mobile website exists mostly to send people to the app, treat it as an acquisition surface and measure the click to the store; the install itself is measured by the app side.
Measuring mobile web and apps in the same project with TapCub
Take the identity example (5,000 web visitors, 3,000 app users, 1,200 overlap) and set it up.
- For mobile web, add the TapCub script from Web analytics › Configuration › SDK code. For the app, register the app and use the iOS, Android, Flutter, React Native or HarmonyOS SDK under App analytics › Configuration › SDK code. Both feed the same project and the same event and user model.
- Call
tapcub.loginwhen someone signs in. After that, the person appears once under All-platform analytics › Users › People, with a day-by-day behavior timeline; once the same sign-in is used on web and in the app, matched people stop being counted twice (the 17.6% in the example). - In Web analytics › Sessions, check the session rule: by default a session ends after 30 minutes idle or 24 hours in total. App launch counting has its own timeout (30 seconds by default for a return from background), set in the app settings, so compare session numbers with that difference in mind.
- Use App analytics › Users › Versions for the version table above and App analytics › Quality & attribution › Stability for crashes.
- In Web analytics › Overview, read bounce rate, and read the app's interested-session counts for the same 10-second, 2-screen or key-event rule.
TapCub does not match installs to ad clicks (it is not an attribution provider); it measures what happens after the visit or install.
FAQ
What is mobile web analytics?
Mobile web analytics measures visits to your website from phone browsers: sources, pages, engagement and conversions, plus page-speed metrics such as LCP and INP. It uses a script on your site and a browser-level identifier.
What is the difference between web analytics and mobile analytics?
Web analytics measures browser visits using page views and a browser identifier; mobile analytics, in the app sense, measures installed apps using screens, install-level identifiers, versions and crash rates. Sessions, retention and fix speed differ too.
How does GA4 define a session on web and app?
A session starts when a user opens the app in the foreground or views a page or screen while no session is active. The default timeout is 30 minutes of inactivity, adjustable, with no upper limit on session length.
Can I combine web and app analytics in one report?
Yes, if both send data to the same project and users sign in with a shared identifier. Without that, show the two as separate lines instead of adding them.
Why do my web and app session counts not match another tool?
Usually the timeout differs. In the example, the same seven events gave 3, 4 or 5 sessions with 30, 10 and 5 minute timeouts. Align the timeout before comparing.
Sources
Was this article helpful?
We use your answers to fix and expand this page.
Couldn’t send. Please try again in a minute.
Thanks for the feedback. We’ll use it to improve this page.You’ve already sent feedback on this page. Thanks.

Data Analyst
Explores traffic sources, conversion funnels, and retention, using clear metric definitions and concrete examples to explain what the numbers mean.