Try it on your own data
Every report in this article is in the free plan. One snippet for web and apps, up to 10 sites.
Start freeThe most important PPC metrics are the ones on the path from spend to profit: cost, conversions, conversion rate, CPA, ROAS and profit after ad cost. Break-even ROAS is 1 ÷ margin, so a ROAS of 4.8 earns $3,680 at a 40% margin and only $800 at 25%. CTR and CPC only diagnose the early steps.
What you will learn
- Follow the path: spend, clicks, conversions, revenue, profit; each other metric diagnoses one step
- Break-even ROAS = 1 ÷ margin: 2.5 at 40%, 4.0 at 25%; break-even CPC = conversion rate × order value × margin
- Campaign X won on CTR (4.0%) and CPC ($0.40) and lost $32 per 10,000 impressions; campaign Y earned $102
The hierarchy: from spend to profit
The important PPC metrics are the ones that sit on the path from money spent to money kept, in order: spend, clicks, conversions, revenue and profit. Everything else is a diagnostic for one step on that path. Learn the path and you stop arguing about which metric "matters most"; you ask which step is leaking.
Each row below is a number you can check on any ad platform report in under a minute. If a report hides one of them, ask for it; a missing step is where a loss usually hides, and an agency or tool that cannot show it has not measured it.
| Step | Metric | Formula | Question it answers |
|---|---|---|---|
| Spend | Cost | What you were charged | How much did we put in? |
| Reach | Impressions, impression share | Impressions ÷ total eligible impressions | How much of the available audience did we get? |
| Attention | Click-through rate (CTR) | Clicks ÷ impressions | Does the ad earn the click? |
| Price of a visit | Cost per click (CPC) | Cost ÷ clicks | What does a visit cost? |
| Action | Conversion rate | Conversions ÷ clicks | Does the landing page turn visits into actions? |
| Price of an action | Cost per acquisition (CPA) | Cost ÷ conversions | What does one customer cost? |
| Return | Return on ad spend (ROAS) | Revenue ÷ cost | How much revenue per unit spent? |
| Profit | Profit after ad cost | Revenue × margin − cost | Did we make money? |
Google Ads defines average CPC as the total cost of clicks divided by the number of clicks (two clicks costing $0.20 and $0.40 average $0.30), conversion rate as conversions per ad interaction (50 conversions from 1,000 interactions is 5%), and impression share as impressions divided by the total eligible impressions. ROAS is conversion value per unit spent: $5 of sales for $1 of ads is a ROAS of 5, or 500%. For deeper analysis of campaigns, see PPC analysis; for reports, see PPC reports.
| Step and metric | Formula | Question it answers |
|---|---|---|
| Attention: CTR | Clicks ÷ impressions | Does the ad earn the click? |
| Price of a visit: CPC | Cost ÷ clicks | What does a visit cost? |
| Action: conversion rate | Conversions ÷ clicks | Does the page turn visits into actions? |
| Price of an action: CPA | Cost ÷ conversions | What does one customer cost? |
| Return: ROAS | Revenue ÷ cost | How much revenue per unit spent? |
| Profit | Revenue × margin − cost | Did we make money? |
CPA = CPC ÷ conversion rate; ROAS = order value ÷ CPA.
One example, every metric
Sample data: a store runs a search campaign for one month.
| Number | Value | How it is calculated |
|---|---|---|
| Cost | $4,000 | Given |
| Impressions | 400,000 | Given |
| Clicks | 8,000 | Given |
| CTR | 2.0% | 8,000 ÷ 400,000 |
| CPC | $0.50 | $4,000 ÷ 8,000 |
| Orders | 240 | Given |
| Conversion rate | 3.0% | 240 ÷ 8,000 |
| CPA | $16.67 | $4,000 ÷ 240 |
| Revenue | $19,200 | 240 orders at $80 |
| ROAS | 4.8 (480%) | $19,200 ÷ $4,000 |
| Profit after ad cost, 40% margin | $3,680 | $19,200 × 0.40 − $4,000 |
Three identities hold the table together, and they are the quickest way to check any report:
- CPA = CPC ÷ conversion rate. $0.50 ÷ 0.03 = $16.67.
- ROAS = order value ÷ CPA. $80 ÷ $16.67 = 4.8.
- Profit per click = conversion rate × order value × margin − CPC. 0.03 × $80 × 0.40 − $0.50 = $0.46 per click, and 8,000 clicks × $0.46 = $3,680.
If the identities do not hold for your numbers, the tools are counting different things, for example clicks in the ad platform against visits in analytics.
Break-even: the number that tells you whether ROAS is good
A ROAS of 4.8 sounds good. Whether it is good depends on your margin, because ROAS counts revenue and you keep only a share of it.
Break-even ROAS = 1 ÷ margin. At a 40% margin, break-even is 1 ÷ 0.40 = 2.5. Below 2.5 you lose money on every dollar of ads.
| Gross margin | Break-even ROAS | Profit at ROAS 4.8 on $4,000 of spend |
|---|---|---|
| 25% | 4.0 | $800 |
| 40% | 2.5 | $3,680 |
| 60% | 1.67 | $7,520 |
Same campaign, same ROAS: $800 profit or $7,520, depending on margin. This is why a target ROAS copied from a blog post is dangerous. Work out your own break-even first.
There are two companion limits you can compute from the same numbers:
- Break-even CPA = order value × margin = $80 × 0.40 = $32. The campaign's CPA of $16.67 is well below it.
- Break-even CPC = conversion rate × order value × margin = 0.03 × $80 × 0.40 = $0.96. You can pay up to $0.96 a click at this conversion rate before profit goes negative; you are paying $0.50.
Why CTR and CPC alone mislead
CTR and CPC are the easiest numbers to see and the easiest to optimise in the wrong direction.
Sample data: two campaigns, 10,000 impressions each, order value $80, margin 40%.
| Campaign X | Campaign Y | |
|---|---|---|
| CTR | 4.0% | 1.5% |
| Clicks | 400 | 150 |
| CPC | $0.40 | $0.60 |
| Cost | $160 | $90 |
| Conversion rate | 1.0% | 4.0% |
| Orders | 4 | 6 |
| Revenue | $320 | $480 |
| CPA | $40 | $15 |
| ROAS | 2.0 | 5.33 |
| Profit after ad cost | −$32 | $102 |
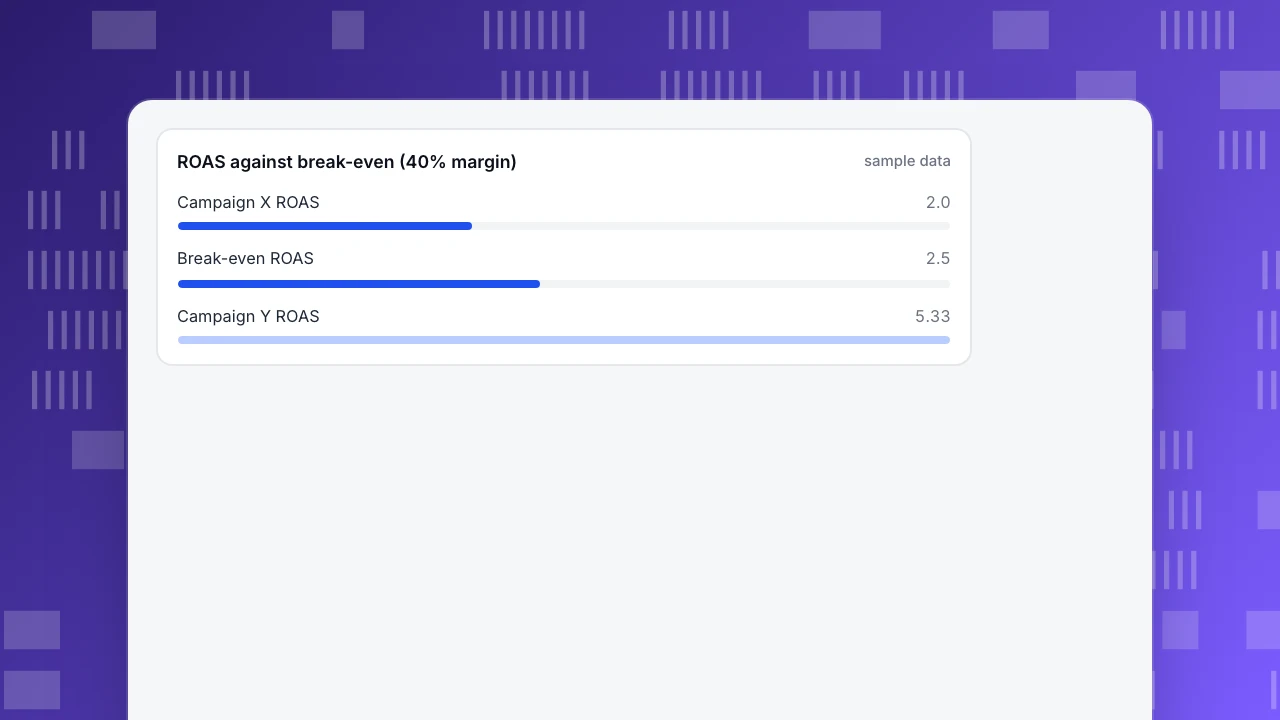
Campaign X wins on CTR and CPC and loses money, because its CPA of $40 is above the $32 break-even and its ROAS of 2.0 is below 2.5. Campaign Y has a lower CTR and a higher CPC and earns $102. A report that stops at CTR and CPC would recommend scaling X.
ROAS against break-even (40% margin)
sample dataRules that point to the step that is leaking
Use the hierarchy as a diagnosis:
- If CTR is low, the ad or the keyword does not match what the searcher wants. Rewrite the ad or tighten the keywords.
- If CPC is high with a good CTR, you are bidding in a competitive auction. Check whether the landing page and ad relevance can lower it before cutting the bid.
- If the conversion rate is low, the problem is after the click: the landing page, the offer, or the form.
- If CPA is above break-even CPA, cut or fix the campaign; if it is below, test more budget.
- If ROAS is below break-even ROAS, same as above, but check order value too; a rise in average order value raises ROAS without changing CPA.
- If revenue per click is falling while CTR rises, the extra traffic is lower quality; look at the search terms and placements.
Do not tune two steps at once. Change the ad and the landing page together and you will not know which one moved the conversion rate.
Which metric goes at the top of the report
The hierarchy is the same for every business, but the number you put first depends on what you are trying to learn.
| Goal | Put first | Why | Supporting numbers |
|---|---|---|---|
| Online store with fixed margins | Profit after ad cost, then ROAS against break-even | Revenue is known per order | CPA, conversion rate, order value |
| Lead generation | Cost per qualified lead, not cost per form fill | A form fill is not a customer | Conversion rate, lead-to-customer rate |
| Subscription product | CPA against the first-year value of a customer | Revenue arrives over months | Trial-to-paid rate, retention |
| New market test | Click-through rate and CPC, for 2 to 4 weeks only | You are measuring interest, not return yet | Visits per day, bounce rate |
Whichever row fits you, keep the full path visible somewhere. Executives will ask for one number; give them one, and keep the others one click away so that when it moves, you can say which step caused it.
Mistakes that break the arithmetic
- Mixing clicks and sessions. A click that never loads the page is a charge without a visit. The two counts differ by a few percent, and the gap is worth knowing.
- Counting view-through or assisted conversions as direct. Decide what a conversion is and keep it fixed.
- Using revenue instead of margin. ROAS counts revenue only; profit needs margin.
- Looking at averages across campaigns. One campaign at ROAS 8 and another at 1.5 can average 4.8 and hide a loss.
- Reading too soon. With 20 orders from about 670 clicks, a measured 3.0% could plausibly be anything from about 1.7% to 4.3%; wait for enough orders before reacting.
Measuring the metrics after the click in TapCub
TapCub does not bid, place or optimise ads. It measures what happens after the click on your site, which is the half of the table that decides profit.
- Tag every ad link with UTM parameters, then read the campaign in Web analytics › Sources: sessions and visitors by source and campaign.
- Set a goal in Web analytics › Goals for the action that matters, such as a purchase or sign-up, to get a conversion rate per campaign.
- In All-platform analytics › Business › Channel ROI, import your daily spend by channel, source and campaign (as a CSV or entry by entry). The page then shows cost per click (spend ÷ sessions), cost per acquisition (spend ÷ purchases in orders) and return on ad spend, grouped by channel, source or campaign.
- Compare TapCub's sessions with the clicks the ad platform reports. TapCub keeps bots and AI crawlers apart and counts only visits that load your page, so its sessions can differ from paid clicks, and a large gap is the first thing to investigate.
- Apply your own break-even: the page gives the numbers, and the margin you set outside TapCub turns them into a verdict.
TapCub reports cost per click as spend divided by sessions, so it is not the same figure as the CPC your ad platform charges per click.
FAQ
What are the most important PPC metrics?
Cost, conversions, conversion rate, CPA, ROAS and profit after ad cost. CTR and CPC are diagnostics for the early steps; the later metrics decide whether the campaign makes money.
What is a good ROAS?
One above your break-even ROAS, which is 1 ÷ margin. At a 40% margin, break-even is 2.5; at 25% it is 4.0. A ROAS of 4.8 is good in the first case and barely profitable in the second.
Is CTR or conversion rate more important?
Neither alone. A high CTR with a low conversion rate buys cheap visits that do not convert; in the sample, a campaign with 4% CTR lost money while one with 1.5% CTR earned $102 per 10,000 impressions.
How do I calculate CPA from CPC?
CPA = CPC ÷ conversion rate. At $0.50 per click and a 3.0% conversion rate, CPA is $16.67.
How many conversions do I need before judging a campaign?
Enough that the rate is stable. With 20 orders from about 670 clicks, a 3.0% rate could plausibly be anything from about 1.7% to 4.3%; hundreds of orders give a figure you can act on.
Sources
- Google Ads Help. Average cost-per-click (Avg. CPC): Definition: total cost divided by clicks; $0.20 and $0.40 clicks average $0.30. Checked 2026-11-21.
- Google Ads Help. Conversion rate: Definition: conversions per interaction; 50 from 1,000 is 5%. Checked 2026-11-21.
- Google Ads Help. About Target ROAS bidding: ROAS as conversion value per unit of cost; $5 of sales for $1 is 500%. Checked 2026-11-21.
- Google Ads Help. Impression share: Definition: impressions divided by total eligible impressions. Checked 2026-11-21.
Was this article helpful?
We use your answers to fix and expand this page.
Couldn’t send. Please try again in a minute.
Thanks for the feedback. We’ll use it to improve this page.You’ve already sent feedback on this page. Thanks.

Product Experience Specialist
Explores usability, user journeys, and feature adoption through practical examples of onboarding and everyday product use.