Try it on your own data
Every report in this article is in the free plan. One snippet for web and apps, up to 10 sites.
Start freeMRR is recurring revenue per month and ARR is the same revenue per year, so ARR = MRR × 12; choose MRR for monthly operations and ARR for annual contracts and planning. The traps are in the conversion: annual plans are divided by 12, and a monthly churn of 4.25% is 40.6% a year, not 51.0%.
What you will learn
- ARR = MRR × 12; MRR for monthly operations, ARR for annual contracts, planning and external reporting
- Build MRR from a bridge: 40,000 + 4,500 + 1,800 − 500 − 1,200 = 44,600, so ARR is $535,200
- Rates compound: 4.25% monthly loss is 40.6% yearly, and ARR is a run rate, not a forecast
How are MRR and ARR related?
MRR (monthly recurring revenue) is the recurring revenue you can expect each month. ARR (annual recurring revenue) is the yearly equivalent. For a subscription business the conversion is one line:
ARR = MRR × 12, and so MRR = ARR ÷ 12
Stripe's help page uses the same relationship: $100 of MRR is $1,200 of ARR, and a $1,200 annual plan counts as $100 of MRR. The two numbers hold the same information at different scales. The choice between them is about which scale fits the decision, not about which is more accurate.
Neither number is revenue in the accounting sense. Stripe says plainly that MRR is "not GAAP revenue". It is a management metric with a definition you choose, which is why writing the definition down matters more than the formula.
What counts as recurring and what does not?
Stripe's definition gives a practical starting list that most teams adopt:
| Include | Exclude |
|---|---|
| Active subscriptions | Trials, until they convert |
| Past-due subscriptions, until they become unpaid | One-time invoices and setup fees |
| Annual plans, divided by 12 | Taxes and application fees |
| Recurring discounts, subtracted | Usage that varies month to month (metered billing) |
Two consequences follow. First, a subscription that moves from past due to unpaid drops out of MRR on that day, so MRR can fall without anyone cancelling. Second, if part of your revenue is metered, MRR × 12 covers only the committed part. Say which parts are included next to the number. Keep a one-line definition in the same spreadsheet as the number (for example: "MRR = active and past-due subscriptions, annual plans ÷ 12, recurring discounts subtracted; trials, one-time fees, taxes and metered usage excluded") so that anyone reading a report can see exactly what was counted.
How do you build MRR and ARR from movements?
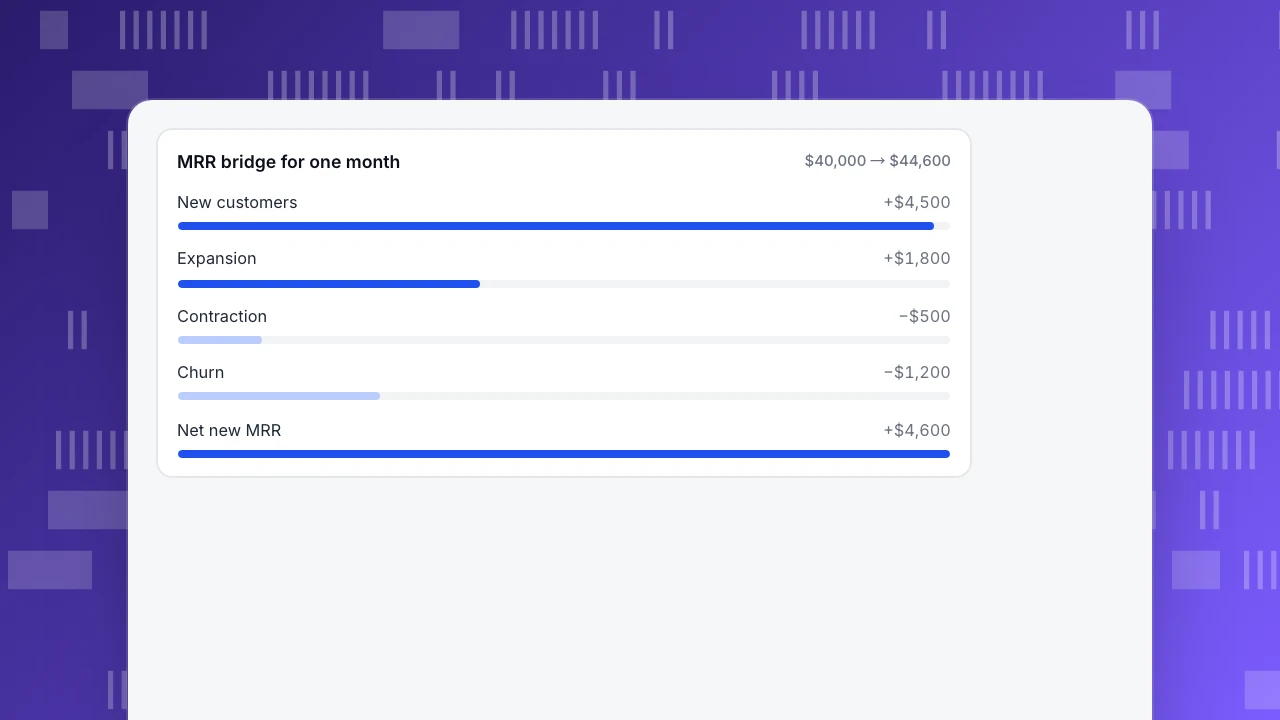
The cleanest way to calculate MRR is a bridge: start with last month's MRR and add or subtract what moved.
Sample data: one month for a small subscription product.
| Movement | MRR |
|---|---|
| Start of month | $40,000 |
| New customers | +$4,500 |
| Expansion (upgrades, extra seats) | +$1,800 |
| Contraction (downgrades) | −$500 |
| Churn (cancellations) | −$1,200 |
| End of month | $44,600 |
Net new MRR = 4,500 + 1,800 − 500 − 1,200 = $4,600. ARR at the start is 40,000 × 12 = $480,000, and at the end 44,600 × 12 = $535,200.
From the same bridge you get the health numbers:
- Gross revenue churn = (500 + 1,200) ÷ 40,000 = 4.25% of starting MRR
- Net revenue retention = (40,000 + 1,800 − 500 − 1,200) ÷ 40,000 = 100.25%
- The business grew by $4,600 even though it lost $1,700 to churn and contraction, because new and expansion revenue outran it
One more ratio comes straight from the bridge: growth inflow divided by loss. Here (4,500 + 1,800) ÷ (500 + 1,200) = 6,300 ÷ 1,700 = 3.7, which reads as "for every $1 lost, $3.70 was added". A value near 1 means the business is replacing what it loses and not growing, whatever the size of ARR.
This bridge works at either scale. Multiply every line by 12 and you have an ARR bridge. Report the bridge, not just the end number: two businesses with the same $535,200 can have very different health, one adding 3.7 for each 1 lost and the other adding 1.1.
MRR bridge for one month
$40,000 → $44,600How do you convert when customers pay monthly and annually?
Customers pay on different cycles, so you normalize each to a month before adding.
Sample data: 300 customers pay $80 a month, and 40 customers pay $960 once a year.
- Monthly customers: 300 × $80 = $24,000 of MRR
- Annual customers: 40 × $960 = $38,400 a year, which is $38,400 ÷ 12 = $3,200 of MRR
- Total MRR = 24,000 + 3,200 = $27,200
- Total ARR = 27,200 × 12 = $326,400, which equals 288,000 + 38,400 from the other direction
Do not add the annual payment into one month. A $960 payment arriving in March would make March MRR look $960 higher, and the next eleven months $80 lower than they are. Cash received and recurring revenue are different questions.
Why can't you multiply a churn rate by 12?
Rates compound, so converting a monthly rate to an annual one is not multiplication.
With 4.25% gross revenue churn a month:
- Naive: 4.25% × 12 = 51.0%
- Compounded: 1 − (1 − 0.0425)¹² = 1 − 0.5938 = 40.6% lost over a year if the same share leaves each month and nothing is added
The difference (10.4 points) is large enough to change a decision. Use the compounded figure whenever you convert a monthly rate to an annual one, and state the period next to every rate. For the broader treatment of ARR itself, see ARR explained with examples and the annual recurring revenue definition.
Is ARR a forecast of next year?
No. ARR is a run rate: what the current subscriptions add up to if nothing changes. It says nothing about customers who will join or leave.
Sample data: today's MRR is $44,600 (ARR $535,200). Suppose each month new and expansion revenue adds $6,300 (4,500 + 1,800) and 4.25% of the previous month's MRR is lost to churn and contraction. Then next month's MRR = this month's × 0.9575 + 6,300.
- After 12 months, MRR is about $86,693 and ARR about $1,040,317, which is 94.4% above today's run rate.
- If those same inflows and losses continued indefinitely, MRR would level off at 6,300 ÷ 0.0425 = $148,235, because the loss grows with the base until it equals the inflow.
Two lessons: ARR today understates growth when inflow is strong, and no amount of inflow gets past the ceiling set by your churn. Forecast with a bridge, not with ×12.
Which should you report: MRR or ARR?
| Situation | Report | Why |
|---|---|---|
| Monthly plans, self-serve | MRR for operations, ARR as a headline | Month-to-month movements are the story |
| Annual contracts, sales-led | ARR | Contracts are annual, and MRR hides renewal timing |
| Weekly review of growth | MRR bridge | Smaller scale shows movement sooner |
| Board, investors, planning | ARR with the bridge | A yearly scale suits yearly decisions |
| Usage-based revenue | Neither alone | Report committed MRR plus actual usage revenue |
Rules of thumb:
- If almost every customer pays monthly, ARR adds nothing but a number twelve times bigger. Use it for communication, not analysis.
- If you publish the number outside the company, define it in writing. When US public companies report a key performance indicator, the SEC's January 2020 guidance (Release 33-10751) asks them to explain how the metric is calculated and why it is useful, and that is a sensible standard for any company.
- Never switch the definition silently. A restated ARR that excludes something it used to include looks like a fall when nothing has changed.
| Situation | Report | Why |
|---|---|---|
| Monthly plans, self-serve | MRR for operations, ARR as headline | Month-to-month movement is the story |
| Annual contracts, sales-led | ARR | MRR hides renewal timing |
| Weekly growth review | MRR bridge | Smaller scale shows movement sooner |
| Board and investors | ARR with the bridge | Yearly scale fits yearly decisions |
| Usage-based revenue | Committed MRR plus usage revenue | ×12 covers only the committed part |
Define the metric in writing before publishing it outside the company.
Where does the ×12 conversion mislead?
- One strong month. Taking one month's MRR × 12 treats a spike as permanent. In the sample, averaging three months ($40,000, $41,800 and $43,000) gives an annualized $499,200, 6.7% below the single-month $535,200.
- Churned but not yet cancelled customers. Past-due subscriptions stay in MRR until they become unpaid, so a payment problem hides for weeks.
- Discounts. Annual deals with large first-year discounts overstate the next year's ARR if the discount ends.
- Commitment versus intent. ARR from a monthly plan can be cancelled in a month; ARR from a two-year contract cannot. The same dollar means different things.
How do you check that your MRR number is right?
Run these five checks before the number goes in a report:
- The bridge closes. End MRR must equal start plus new, expansion, contraction and churn. If it does not, a movement is missing.
- Trials are out. Sample data: counting 30 trial accounts at $80 would add $2,400 to MRR, an overstatement of 5.4%, and $28,800 to ARR.
- One-time money is out. Setup fees, hardware and one-off invoices do not recur.
- Annual plans are divided by 12, not booked in the month of payment.
- Customer counts tie. Customers × average price should land near MRR; a large gap points to discounts, free plans or duplicates.
How can you look at MRR and ARR drivers in TapCub?
TapCub does not read your billing system and does not calculate MRR or ARR; billing, invoices and payment recovery are outside the product. What it measures well is what feeds the bridge.
- New. Open Web analytics › Sources to see which channels bring the visitors who become customers, and Web analytics › Goals to count the signup or checkout event.
- Funnel to paid. In All-platform analytics › Behavior › Behavior analysis, build a funnel from signup to your paid event and see where people stop, then break it down by channel.
- Churn signals. The same screen's retention view shows whether people who started a paid action still come back in later weeks, so you see the decline before it appears in MRR.
- A tracked proxy. If your server sends a subscription event with the plan's monthly price as a property, All-platform analytics › Behavior › Metrics & SQL can sum that property as a custom metric (a property sum), for example "new MRR booked". Treat it as a product-side proxy and keep your billing system as the number you report.
TapCub tells you which channels and behaviors lead to paying customers. It does not score leads, manage subscriptions or reconcile payments.
FAQ
What is the difference between MRR and ARR?
MRR is recurring revenue per month and ARR is recurring revenue per year. For subscription products ARR = MRR × 12. Use MRR for monthly operations and ARR for annual planning and external reporting.
How do you convert MRR to ARR?
Multiply by 12. A business with $44,600 of MRR has $535,200 of ARR. For annual plans, divide the yearly price by 12 to get MRR first, then add it to the monthly plans.
Which is better, MRR or ARR?
Neither is more accurate. MRR shows movement sooner and suits monthly plans; ARR suits annual contracts and yearly planning. Report the one that fits the decision, and state the definition.
Is ARR the same as revenue?
No. Recurring revenue metrics are management measures, not accounting revenue. Stripe notes that MRR is not GAAP revenue. ARR also excludes one-time fees and usually excludes taxes and trials.
Can you multiply monthly churn by 12 to get yearly churn?
No. Rates compound. A 4.25% monthly loss is about 40.6% over a year, not 51.0%.
Sources
- Stripe, Understanding Monthly Recurring Revenue (MRR) and Annual Recurring Revenue (ARR): MRR and ARR definitions, ARR = MRR × 12, inclusions and exclusions, not GAAP revenue. Checked 2026-11-21.
- U.S. Securities and Exchange Commission, Commission Guidance on Management's Discussion and Analysis (Release 33-10751), 30 January 2020: guidance on key performance indicators and metrics. Checked 2026-11-21.
Was this article helpful?
We use your answers to fix and expand this page.
Couldn’t send. Please try again in a minute.
Thanks for the feedback. We’ll use it to improve this page.You’ve already sent feedback on this page. Thanks.

Product Analyst
Focuses on event analysis, conversion funnels, and retention, using clear metric definitions and structured analysis to explain product performance.