Try it on your own data
Every report in this article is in the free plan. One snippet for web and apps, up to 10 sites.
Start freeA multi-touch attribution tool splits the credit for a conversion across several earlier touchpoints, and the right one is chosen on criteria, not on the model list: data inputs, windows, path transparency, cost data, privacy and limits. This guide shows one journey under five models, how the lookback window moves credit and a weighted rubric you can use in a trial.
What you will learn
- Every serious tool offers several models; judge it on data inputs, windows, path transparency, cost data, privacy, export and limits
- The lookback window alone can move $20 of credit from paid social to zero in the sample; ask whether it is adjustable
- Weights decide the winner: tool A scores 74.0 vs 66.0 for a regulated company, tool B 76.0 vs 62.0 for a paid media team
What counts as a multi-touch attribution tool
A multi-touch attribution tool takes the sessions that came before a conversion and splits the credit for it across several of them, instead of giving it all to the first or last click. To qualify, it needs three things: a record of each visitor's earlier touchpoints, a rule for dividing credit, and a report that shows the result by channel, source or campaign.
Several things get sold under the same name and are not the same. Ad-platform reports credit only that platform's own clicks. Marketing mix modelling estimates channel effects from aggregate spend and sales, with no individual paths. Mobile click-to-install matching ties an ad click to an app install. This article is about the first kind of tool: path-based, using your own site or app data.
The question to settle before any demo is what you will do differently with the answer. If the answer is "move budget between channels", you need cost data in the same place as credit. If it is "see which content assists", you need path detail. The criteria below follow from that. For how each model works, see multi-touch attribution and attribution models; this article is about choosing a tool.
One journey, five models
Models are not the thing to compare tools on, because every serious tool offers several. But you should see how much they disagree, because that disagreement is the reason to use a tool at all. Sample data: one customer places a $100 order at the end of this journey.
| Touchpoint | Days before order | First | Last | Linear | Position | Time decay (7-day half-life) |
|---|---|---|---|---|---|---|
| Paid social | 12 | $100.00 | $0 | $20.00 | $40.00 | $9.50 |
| Organic search | 9 | $0 | $0 | $20.00 | $6.67 | $12.78 |
| 4 | $0 | $0 | $20.00 | $6.67 | $20.98 | |
| Paid search | 2 | $0 | $0 | $20.00 | $6.67 | $25.57 |
| Direct | 0 | $0 | $100.00 | $20.00 | $40.00 | $31.17 |
| Total | $100 | $100 | $100 | $100 | $100 |
Position-based gives the first and last touch 40% each and splits the remaining 20% across the middle three, 6.67% each. Time decay weights each touch by 0.5 raised to (days before ÷ 7): 0.305, 0.410, 0.673, 0.820 and 1.0, which sum to 3.208; each share is its weight ÷ 3.208 (paid social 0.305 ÷ 3.208 = 9.5%).
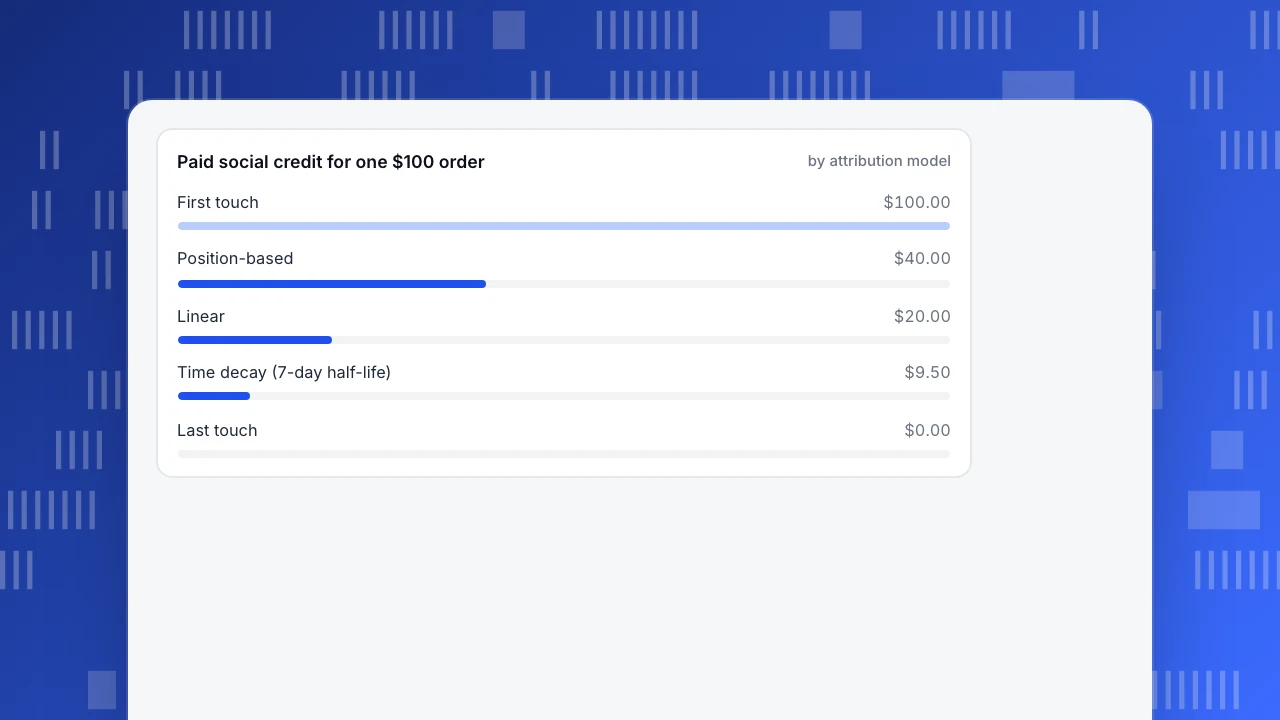
Paid social earns $100 or $0 depending on the model. A tool that shows only one model hides that. The first requirement is therefore to see several models next to each other on the same data.
Paid social credit for one $100 order
by attribution modelEight questions to ask any tool
| Criterion | Ask | Warning sign |
|---|---|---|
| Data inputs | Which sources does it read (site, app, server events, imports)? | Needs a separate tag per channel |
| Identity | How does it link sessions of the same person across devices? | Claims full cross-device with no login |
| Models and windows | Which models, and can you change the lookback window? | One fixed model or window |
| Path transparency | Can you list the actual paths behind a number? | Only aggregated charts |
| Cost and ROI | Can you import spend and get return per channel? | Credit with no cost |
| Privacy | Where is data stored, what needs consent, is there a processor contract? | No answer in writing |
| Export and API | Can you export paths and credit? | Locked reports |
| Limits and price | Caps on conversions, events or history? | Limits only found in the contract |
| Criterion | Ask | Warning sign |
|---|---|---|
| Models and windows | Which models, and can you change the lookback window? | One fixed model or window |
| Path transparency | Can you list the paths behind a number? | Only aggregated charts |
| Cost and ROI | Can you import spend and get return per channel? | Credit with no cost |
Score each criterion 1–5, multiply by a weight you set before any demo, and divide the sum by 5.
Lookback window changes who gets credit
The lookback window is how far back a tool looks for touches, and it quietly changes results. Using the same journey, a 7-day window drops the paid social touch (12 days before) and the organic search touch (9 days before). Three touches remain.
| Touchpoint | 30-day window, linear | 7-day window, linear |
|---|---|---|
| Paid social | $20.00 | $0 |
| Organic search | $20.00 | $0 |
| $20.00 | $33.33 | |
| Paid search | $20.00 | $33.33 |
| Direct | $20.00 | $33.33 |
Same order, same model, and paid social goes from $20 to zero because of a settings choice. Ask whether the window is adjustable and what the default is. Match it to your real buying cycle: if most buyers convert within a week, a 7-day window is right; if buying takes a month, a short window under-credits the early channels.
For reference, Google Analytics 4 reattributes data-driven conversions for up to 7 days after the conversion happens, so recent numbers can still move.
Transparency: can you see the paths
A credit table is a summary. The test for any tool is whether you can click through to the paths that produced a number. Take the sample: if a report says paid social earned $20 of linear credit, you should be able to find that journey and see the five touches. If you cannot, you cannot audit it, and you will not know when a tagging error is creating credit for the wrong channel.
Look for these in a trial: a path list with dates, a way to filter by one channel, and the ability to export the rows. Ask about sample size too: if a tool computes credit from a small subset of conversions, say so in the report. A hard cap on conversions is fine as long as it is documented.
Cost: credit alone is not a decision
Attribution tells you which channels took part; spend tells you whether it was worth it. Sample data: paid social cost $1,500 last month.
| Model | Credited revenue | ROAS (revenue ÷ spend) |
|---|---|---|
| Last touch | $1,000 | 0.67 |
| Linear | $3,000 | 2.00 |
| First touch | $4,500 | 3.00 |
The same spend looks like a loss under last touch and a win under first touch. That is not a flaw in the tool; it shows that paid social mostly starts journeys that other channels finish. The decision is to look at the channel's role, then test it: pause it in one region for a few weeks and see whether total orders fall, which no attribution model can tell you.
So choose a tool where spend and credit sit in one report, otherwise you will be exporting to a spreadsheet each month.
Privacy and governance
Path tracking stores behaviour over time, so the legal basis matters. Ask where data is stored, which collection level applies by region, and what happens before consent. If the vendor processes personal data for you, Article 28 of the GDPR requires a written contract that covers documented instructions, confidentiality, security measures, sub-processor authorisation, help with data subject requests, deletion or return at the end, and audits. Ask for that contract before you sign, not after.
Score tools against your own weights
A rubric stops a demo from deciding for you. Score each criterion from 1 to 5, multiply by your weight, sum, and divide by 5 to get a score out of 100. Sample data: two anonymous tools, A and B, scored in two situations.
| Criterion | Regulated company weight | Paid media team weight | Tool A | Tool B |
|---|---|---|---|---|
| Data inputs | 20 | 15 | 4 | 3 |
| Models and windows | 15 | 25 | 3 | 5 |
| Path transparency | 15 | 5 | 5 | 2 |
| Cost and ROI | 10 | 30 | 2 | 4 |
| Privacy | 25 | 10 | 4 | 3 |
| Export and API | 10 | 10 | 3 | 4 |
| Limits and price | 5 | 5 | 4 | 2 |
| Weighted score, regulated company | 74.0 | 66.0 | ||
| Weighted score, paid media team | 62.0 | 76.0 |
Tool A wins for the regulated company (74.0 against 66.0) and Tool B wins for the paid media team (76.0 against 62.0). Neither tool is better; the weights decide. Write your weights down before you watch any demo.
A 30-day trial plan
- Pick 3 channels and 1 conversion you can verify in your own order system.
- Run the tool for 30 days and compare its conversion count with your order system. A gap of more than about 5% means a tracking problem to fix before reading any credit.
- Open five real paths and check them by hand.
- Compare two models and one window setting; note which channels change rank.
- Decide one budget action and one test, and write down what result would change your mind.
In TapCub
TapCub's attribution works on your own site and app data, not on install postbacks; the compare attribution models help page walks through the screen.
- Open All-platform analytics › Behavior › Behavior analysis and choose attribution. Pick several models at once, among first, last, linear, position and time decay; each becomes its own column so channels that only assist stand out.
- Set the touchpoint dimension (channel by default, or source, UTM source, UTM campaign, source domain or landing page) and the lookback window (default 30 days, 1 to 90, including the converting session). Time decay has a half-life, 7 days by default.
- Use the paths to check credit: the report counts paths per touchpoint, and the touchpoint conversion rate is paths ÷ touchpoint sessions. It computes up to 50,000 conversions.
- For cost, import spend by day, channel, source or campaign in All-platform analytics › Business › Channel ROI; it shows cost per click, cost per acquisition and return on ad spend.
TapCub is not an attribution vendor for app installs: it does not match ad clicks to installs. It also does not run budget tests; it measures them.
FAQ
What is a multi-touch attribution tool?
It is software that splits credit for a conversion across several earlier touchpoints, using a rule such as linear, position-based or time decay, and reports the result by channel, source or campaign. It needs each visitor's earlier touchpoints to work.
How do I choose a multi-touch attribution tool?
Decide the action first, then score tools on data inputs, models and windows, path transparency, cost and return, privacy, export and limits, using weights you wrote before any demo. Run a 30-day trial and check the conversion count against your order system.
Which attribution models should a tool offer?
At least first, last, linear, position-based and time decay, shown side by side. Google Analytics 4 removed its first-click, linear, time-decay and position-based reporting models in November 2023, so check what any tool still offers.
Does the lookback window matter?
Yes. In the sample, a 7-day window drops two of the five touches and moves credit from paid social to the last three channels. Match the window to your real buying cycle.
Do I need multi-touch attribution at all?
If you run few channels or most buyers convert in one visit, last-touch reporting may be enough. Multi-touch becomes worth it when buyers take several visits across channels and you move budget between them.
Sources
- Google Analytics Help, Attribution models (data-driven and last-click models; first-click, linear, time-decay and position-based removed November 2023; reattribution up to 7 days). Checked 2026-11-21.
- Shao and Li, Data-driven multi-touch attribution models, KDD 2011 (the data-driven approach to crediting touchpoints). Not re-fetched on 2026-11-21 (publisher returned 403).
- GDPR-Info.eu, Article 28: Processor (written contract terms: instructions, confidentiality, security, sub-processors, deletion or return, audits). Checked 2026-11-21.
Was this article helpful?
We use your answers to fix and expand this page.
Couldn’t send. Please try again in a minute.
Thanks for the feedback. We’ll use it to improve this page.You’ve already sent feedback on this page. Thanks.

Customer Experience Consultant
Writes about live chat, visitor conversations, and self-service, sharing practical ways to make customer communication clearer and more effective.