Try it on your own data
Every report in this article is in the free plan. One snippet for web and apps, up to 10 sites.
Start freeA multivariate test changes several page elements at once and shows every combination, so it can tell you which element worked and whether elements interact. Its cost is traffic: in our example, a 10% lift on a 3.0% page needs 106,420 visitors as an A/B test but 676,480 if you compare 8 cells one by one with a correction.
What you will learn
- Combinations multiply: 2 × 2 × 2 is 8, 5 × 4 × 3 is 60; at 30,000 visitors a week, 60 cells get 500 each
- Comparing every cell with a control costs 4 to 6 times an A/B test (425,680 to 676,480 vs 106,420); testing effects in a factorial design costs 169,120
- Divide the required total by weekly traffic; if it is over 4 to 6 weeks, cut options or run A/B tests in sequence
What a multivariate test is
A multivariate test (MVT) changes several elements of a page at once and shows visitors every combination. An A/B test changes one thing, or one bundle of things, and compares two versions. If you want to know whether a new headline, a new hero image or a new button label helps, an A/B test needs three runs, one after another. An MVT with two options per element shows all 2 × 2 × 2 = 8 combinations in a single run.
The promise is speed and a second answer: not just which version won, but which element did the work and whether two elements help or hurt each other. The cost is traffic. Every combination needs visitors, and the more combinations there are, the thinner each one gets. This article does the arithmetic so you can decide before you build anything.
If you are comparing one change against another, start with the A/B testing guide instead. MVT is the same method with more arms.
Count the combinations first
The number of combinations is the product of the number of options in each element. NIST's engineering handbook describes the simplest case: three elements with two levels each is a 2³ design with eight runs, and a replication doubles it.
| Page elements and options | Combinations | Visitors per combination per week at 30,000 visitors |
|---|---|---|
| Headline (2) × image (2) × button (2) | 8 | 3,750 |
| Headline (3) × image (2) × button (2) | 12 | 2,500 |
| Headline (5) × image (4) × button (3) | 60 | 500 |
| Headline (4) × image (3) × layout (3) × button (2) | 72 | 417 |
Sample data: 30,000 visitors per week split evenly. Adding one extra option to one element can add a whole row of combinations at once: going from 2 to 3 headlines raises 8 combinations to 12, not to 9.
| Elements and options | Combinations | Visitors per cell per week at 30,000 |
|---|---|---|
| Headline (2) × image (2) × button (2) | 8 | 3,750 |
| Headline (3) × image (2) × button (2) | 12 | 2,500 |
| Headline (5) × image (4) × button (3) | 60 | 500 |
| Headline (4) × image (3) × layout (3) × button (2) | 72 | 417 |
Sample data: 30,000 visitors per week split evenly between combinations.
What the traffic requirement looks like
Use one fixed example. Sample data: the page converts at 3.0%, and you want to detect a lift of 10% relative, from 3.0% to 3.3%, at the 5% significance level with 80% power. The standard two-proportion normal approximation (1.96 for the 5% level, 0.84 for power) gives 53,210 visitors per version.
Three ways of running the same question:
| Design | Visitors needed | Weeks at 30,000 per week |
|---|---|---|
| A/B test, 2 versions | 2 × 53,210 = 106,420 | 3.5 |
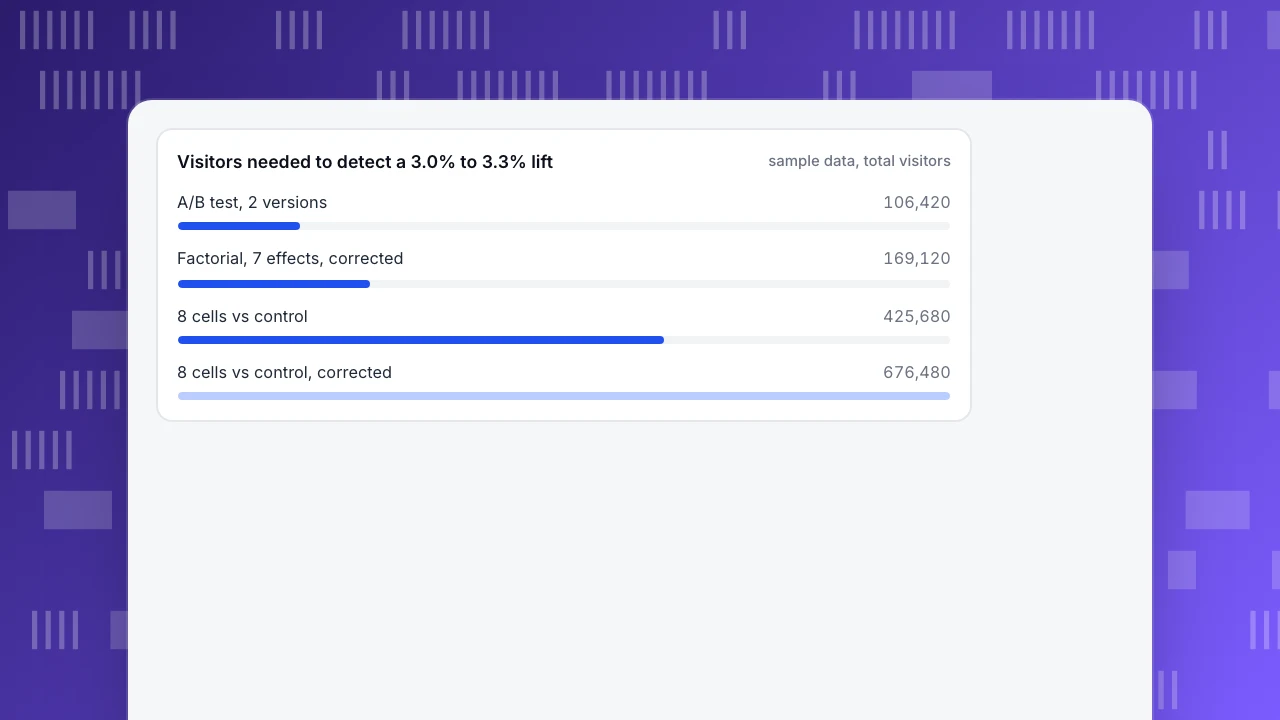
| 8 combinations, each compared with the control cell | 8 × 53,210 = 425,680 | 14.2 |
| Same 8 cells, 7 comparisons with a Bonferroni correction (α = 0.05 ÷ 7) | 8 × 84,560 = 676,480 | 22.5 |
The Bonferroni row is the one most guides skip. When you compare seven cells with a control, the chance that at least one looks significant by luck is far above 5%; dividing α by the number of comparisons keeps the overall error near 5% but pushes the per-cell sample from 53,210 to 84,560. The common claim that an MVT "needs more traffic than an A/B test" is true by a factor of 4 to 6 in this example, if you plan to find the winning cell.
Effects that are smaller are much worse, because the sample grows with the inverse square of the effect:
| Lift to detect (relative, from 3.0%) | A/B total | Weeks at 30,000 per week |
|---|---|---|
| 20% | 27,828 | 0.9 |
| 10% | 106,420 | 3.5 |
| 5% | 415,876 | 13.9 |
To turn this into a go or no-go, multiply the visitors the page gets in a week by the weeks you can wait, and compare with the totals above. A page with 12,000 visitors a week and a 5-week limit has 60,000 visitors to spend. That is enough to find a 20% lift, either as an A/B test (27,828) or as a 7-effect factorial design (44,222). It is nowhere near enough for a 10% lift (106,420 and 169,120). A change that wins by less than the size you planned for will look like noise; that is the arithmetic, not a failure of the test.
Visitors needed to detect a 3.0% to 3.3% lift
sample data, total visitorsThe factorial shortcut: test effects, not cells
There is a cheaper way, and it is where MVT earns its name. In a balanced full factorial design, every visitor contributes to every element's estimate. The effect of the headline is the average of the four cells that show headline B minus the average of the four that show headline A, so each side has half of all visitors. That is the same precision as an A/B test with the same total traffic.
For the 10% lift example, one effect, for instance the button, needs 106,420 visitors in total, the same as the A/B test, and the headline and the image are estimated from the same visitors at no extra cost. With three elements there are 7 effects to look at: 3 main effects, 3 two-way interactions and 1 three-way interaction. Applying the same Bonferroni split to 7 effects gives 2 × 84,560 = 169,120 visitors, or 5.6 weeks at 30,000 per week, instead of 22.5.
Two conditions make this work:
- You read effects, not cell winners. You ask "does button B help on average, across all headlines and images?" You do not ask "which of the 8 cells is the best?" The second question is the expensive one.
- The effects you want are about the size you planned for. Interactions are usually smaller than main effects. An interaction half the size of the main effect needs four times the traffic to detect.
When MVT beats A/B testing
Use these rules, in order:
- Divide your required total by weekly traffic. If the result is under 4 to 6 weeks, run it. If not, cut options (next section) or run A/B tests in sequence.
- If you suspect an interaction, for example a long headline only works with a short button label, MVT is the only way to see it in one run. Two separate A/B tests cannot show it.
- If you only need the best of three headlines, run an A/B/n test on the headline. You do not need images and buttons in the experiment.
- If the elements are tied to one idea, such as a new page design, treat the whole design as one version in an A/B test. MVT is for elements you can mix and match.
- If traffic is low (a few thousand visitors per week), no MVT will finish. Make bigger changes and use plain A/B tests.
How to cut the number of combinations
When the arithmetic says 14 weeks, shrink the design rather than waiting:
- Drop elements that you expect to matter least. Three elements at two levels is 8; four is 16.
- Drop options. Test the two strongest headline candidates, not five.
- Merge related changes into one element, such as image and caption.
- Test the biggest idea first with an A/B test, then run a small MVT on what is left.
- Consider a fractional design, which runs a chosen subset of the cells and gives up some interactions. This is a statistics job; the cost is that some effects can no longer be told apart.
Analysis mistakes that cost you the result
- Stopping when a cell looks good. Looking daily and stopping at the first significant result inflates false alarms; our A/A testing article shows the size, 25% after 20 looks at a 5% level. Fix the sample size and the end date first; if you must look early, use a method built for it, such as sequential testing.
- Reading a significant interaction without its size. Report the difference and its interval, not only the label.
- Unequal cells. If one combination loads slower, it gets fewer completed views. Check the split before reading results.
- Counting bots. Automated visits in one cell change its rate.
- Ignoring segments. A combination that wins on desktop may lose on mobile; plan the segments before the test, since splitting afterwards multiplies comparisons.
Measuring a multivariate test in TapCub
TapCub does not create variants, split traffic or run experiments, and it does not decide which cell wins. It measures what your testing tool produces.
- Have your testing tool send the combination, for example
h2-i1-b2, as an event property, or use a distinct URL parameter per combination. - In All-platform analytics › Behavior › Behavior analysis, build a funnel from the landing page to your goal and break it down by that property. A breakdown keeps the 10 groups with the most entries, so an experiment with 12 or more combinations will lose the smallest groups; keep the design at 10 or fewer or group combinations by element.
- Check the visitor counts per combination against the plan before you read any conversion rates. A visible mismatch is a reason to stop.
- Read the result over full weeks and compare against the sample size you fixed. Real people and bots are counted apart, so crawlers do not enter the denominator.
- For why a combination loses, open All-platform analytics › Behavior › Heatmaps or Session replay on that page; session replay is off by default and must be turned on.
FAQ
What is the difference between multivariate testing and A/B testing?
An A/B test compares two versions that differ in one way or as one bundle. A multivariate test varies several elements at once and shows every combination. It can show which element mattered and whether elements interact, but needs more traffic.
How many visitors does a multivariate test need?
It depends on the baseline and the lift you want to detect. In our example, 3.0% baseline and a 10% relative lift, a single effect needs about 106,420 visitors in total, and comparing 8 cells one by one with a multiple-comparison correction needs 676,480.
How many combinations can I test?
As many as your traffic allows. With 30,000 visitors a week, 8 combinations get 3,750 each per week and 60 get 500. If the arithmetic gives more than 4 to 6 weeks, remove options.
Is multi-variate testing the same as multivariate testing?
Yes, they are different spellings of the same term in marketing. It is not the same as multivariate statistics, where several outcome variables are analysed together.
Can TapCub run a multivariate test?
No. TapCub measures results; your testing tool creates the variants and splits visitors. TapCub shows funnels broken down by the combination you send.
Sources
- NIST/SEMATECH e-Handbook of Statistical Methods, 5.3.3.3.1 Two-level full factorial designs: a 2³ design takes eight runs and a replication doubles it. Checked 2026-11-21.
- NIST/SEMATECH e-Handbook, 7.3.3 Comparing two proportions: z statistic for two proportions used for the sample sizes. Checked 2026-11-21.
- Evan Miller, How Not To Run An A/B Test: stopping at the first significant result inflates false positives; decide the sample size in advance. Checked 2026-11-21.
Was this article helpful?
We use your answers to fix and expand this page.
Couldn’t send. Please try again in a minute.
Thanks for the feedback. We’ll use it to improve this page.You’ve already sent feedback on this page. Thanks.

Product Experience Specialist
Explores usability, user journeys, and feature adoption through practical examples of onboarding and everyday product use.