Try it on your own data
Every report in this article is in the free plan. One snippet for web and apps, up to 10 sites.
Start freeAn A/A test shows two groups the exact same page to check the experiment itself, not to pick a winner. A healthy setup still flags about 1 test in 20 as significant at the 5% level, splits visitors as planned and records the same events in both groups. If any of those fails, fix it before trusting an A/B result.
What you will learn
- A correct A/A test is significant about 5% of the time at the 5% level: 4.96% in our 10,000-test simulation, not 0%
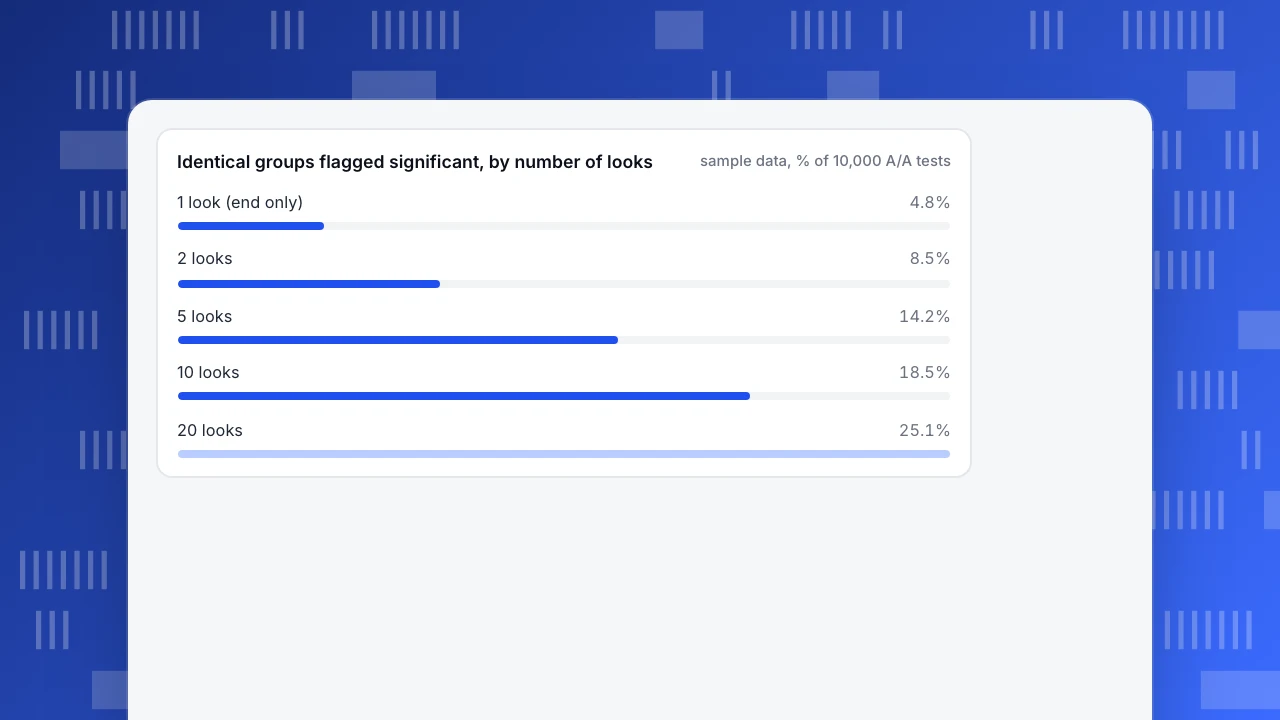
- Peeking turns that 5% into 8.5% with 2 looks and 25.1% with 20; check the split with a chi-square test first (50,900 / 49,100 gives 32.4, far above 3.84)
- Run one when you adopt or change a tool or metric; skip it when the setup is validated and every test checks its own split
What an A/A test checks
In an A/A test, both groups get the same experience. The page, the offer and the code are identical; only the assignment is random. Because there is no real difference to find, the test cannot crown a winner. It checks the experiment machinery: whether visitors are split the way you intended, whether the same events are recorded in both groups, and whether the "significant" label appears about as often as the maths says it should.
That last check is the one people forget. At a 5% significance level, a correct setup should show a significant difference between two identical groups in roughly 1 test out of 20. Not zero. If your tool reports significance far more often, or far less often, you cannot trust its A/B results either.
An A/A test answers three questions, and each one has a number you can compare against:
| Question | Number to compare | Healthy result |
|---|---|---|
| Is the split what you asked for? | Visitors per group vs the planned ratio | No sample ratio mismatch (below) |
| Is tracking the same in both groups? | Event counts and goal rates per group | Differences within noise |
| Is the error rate honest? | Share of identical pairs flagged significant | About 5% at the 5% level |
If you are comparing two different versions and want to know how to read the result, that is a different job; see the A/B testing guide and statistical significance.
| Question | Number to compare | Healthy result |
|---|---|---|
| Is the split what you asked for? | Visitors per group vs the planned ratio | No sample ratio mismatch (χ² below 3.84) |
| Is tracking the same in both groups? | Event counts and goal rates per group | Differences within noise |
| Is the error rate honest? | Share of identical pairs flagged significant | About 5% at the 5% level |
Sample data: 10,000 simulated A/A tests, 5,000 visitors per group, 4% true rate.
What a healthy A/A result looks like
We simulated 10,000 A/A tests in Python. Each test had two groups of 5,000 visitors and a true conversion rate of 4% in both. Each pair was compared once at the end with a two-proportion z-test (the pooled-proportion version in the NIST/SEMATECH handbook) at the 5% level.
Sample data result: 496 of the 10,000 tests came out significant, 4.96%. That is what a correct setup looks like: close to 5%, not 0%.
Two consequences follow:
- A single "significant" A/A result is not proof of a fault. About 1 in 20 healthy tests will show one. Run the test again or look at the other two checks before you blame the tool.
- A tool that never flags anything is not "conservative"; it is probably losing power. Over many A/A runs, the p-values should be spread evenly between 0 and 1, so 10% of them fall below 0.10.
How to run an A/A test
- Pick the metric and the unit. Choose one conversion goal and decide whether you count visitors or sessions. Use the same ones you plan to use in real tests.
- Fix the sample size before you start. Use the same sample size your next real test will need (see the sample-size section). Write it down.
- Split 50/50 and run full weeks. Weekday and weekend behaviour differ, so run at least 7 days or a multiple of 7.
- Check the split first. Test whether the group sizes match the plan (the next step shows how). A bad split makes every other result meaningless.
- Then compare the goal rate once, at the planned sample size. Look at the observed difference and its interval, not only the label.
- Repeat if you can. One run can be unlucky; three runs give you a rough rate of false alarms.
Check the split: sample ratio mismatch
A sample ratio mismatch (SRM) means the groups are not the size the design says they should be. The standard check is a chi-square test of the observed counts against the expected 50/50 split: χ² = Σ (observed − expected)² ÷ expected, compared with 3.84 for one degree of freedom at the 5% level.
Sample data, 100,000 visitors expected to split 50,000 / 50,000:
| Observed | Calculation | χ² | Verdict |
|---|---|---|---|
| 50,300 / 49,700 | (300² + 300²) ÷ 50,000 | 3.6 | Within noise (below 3.84) |
| 50,900 / 49,100 | (900² + 900²) ÷ 50,000 | 32.4 | Mismatch: stop and investigate |
The second split looks tiny, 50.9% against 49.1%, and it is far outside what chance produces. Common causes are redirects that drop some visitors in one group, a script that loads more slowly in one variant, and bots that are assigned to only one group.
Why peeking breaks an A/A test
The 4.96% above assumed one look at the end. Most teams look every day. Each extra look is another chance for a false alarm, and the chances add up.
We repeated the simulation with a fresh 10,000 pairs and checked at equal steps through the 5,000 visitors per group, stopping the moment any check was significant:
| Looks | Tests flagged significant (identical groups) |
|---|---|
| 1 (end only) | 4.8% |
| 2 | 8.5% |
| 5 | 14.2% |
| 10 | 18.5% |
| 20 | 25.1% |
Twenty looks at a 5% level turn a 1-in-20 risk into 1 in 4. Evan Miller's well-known article reports the same effect with a different design: with a 50% baseline and stopping the moment a check hits 5% or at 150 observations, he gets a 26.1% false-positive rate, and he notes that fixing the sample size in advance removes the problem.
The numbers also explain why an A/A test is the cheapest way to teach a team why "it was significant on Tuesday" is not a result. Run one where people are allowed to peek, show the table above, and then agree on the sample size and the reading date.
Identical groups flagged significant, by number of looks
sample data, % of 10,000 A/A testsHow much traffic an A/A test needs
An A/A test needs enough visitors that its noise matches the size of the effects you hope to find later. Use the standard normal approximation for two proportions, with 1.96 for the 5% level and 0.84 for 80% power.
Sample data: baseline conversion 4%, 5,000 visitors per group.
- Standard error of the difference = √(2 × 0.04 × 0.96 ÷ 5,000) = 0.39 percentage points.
- Two identical groups will differ by more than 1.96 × 0.39 = 0.77 points about 5% of the time.
- The smallest true difference this size can reliably detect is (1.96 + 0.84) × 0.39 ≈ 1.1 points, which is 27% of the 4% baseline.
So at 5,000 per group, a real lift of 0.5 points (12.5% relative) is invisible, and any A/A difference under 0.77 points is just noise. If your team wants to find 10% relative lifts on a 4% baseline (0.4 points), the same approximation asks for about 39,500 visitors per group, not 5,000. Whatever the size, the A/A test only tells you about the tool at that size.
When an A/A test is worth running
An A/A test costs traffic and calendar time and tests nothing about your page. Use these rules:
- Run one when you adopt or change an experimentation tool, change how visitors are assigned or identified, add a new primary metric, or meet an unexplained sample ratio mismatch.
- Skip it when the tool and metric are already validated and every test runs an automatic split check. The split check is free, because it only needs the counts you already have.
- Run it on a site slice if traffic is scarce. A smaller A/A test can still verify the split and the event counts; it just cannot confirm a 5% error rate precisely.
Researchers who run experiments at scale treat A/A tests and sample ratio checks as data-quality safeguards for the platform itself, which is the same reason to run one when something changes.
What to do when an A/A test fails
| Symptom | Likely cause | What to check |
|---|---|---|
| Group sizes off by a few percent | Redirects, slow-loading variant, bot assignment | Compare the split by browser, device and country |
| One group has fewer events | Tracking code missing or blocked in one variant | Fire the same test event in both groups and count it |
| Significant in many repeats | Peeking, or the unit differs from the metric (visitors vs sessions) | Fix the sample size, count the same unit |
| Never significant, even across many runs | Variance is overstated, or the metric is clipped | Compare the raw spread of the metric between groups |
Doing the groundwork in TapCub
TapCub does not split traffic or run experiments; it measures. The part of an A/A test that happens on the measurement side is still useful, and you can run a rehearsal of it.
- Create two segments with the random bucket condition in All-platform analytics › Users › Segments & tags, so each holds a random half of visitors.
- In All-platform analytics › Behavior › Behavior analysis, run the same goal funnel for each segment, since a segment can be applied to a funnel, and compare completion rates.
- Compare the two groups' visitor counts using the checks above. Differences within the noise band are what you want to see.
- Open Web analytics › Bots to confirm automated traffic is counted apart from visitors, since a bot assigned to one group is a common cause of mismatch. Bots and AI crawlers are not in the visitor counts or in the conversion denominator.
If your experimentation tool writes the variant into an event property, you can compare arms on the same goals. The split itself, and the decision of the winner, stay in that tool.
FAQ
What is an A/A test?
An A/A test splits visitors into two groups and shows both the same page. It exists to check the experiment setup, not to find a winner: the split, tracking and error rate should all look as expected.
How long should an A/A test run?
Run it for the sample size you fixed in advance, rounded up to whole weeks. For a 4% baseline and a 1.1-point detectable difference, that is about 5,000 visitors per group; for 10% relative lifts, about 39,500.
Is it normal for an A/A test to show a significant result?
Yes, about 1 time in 20 at the 5% level. That is why one significant result is a reason to repeat and check the split, not proof the tool is broken.
What does "AT test" mean?
There is no standard statistical test called an "AT test". People who type it usually mean an A/A test, an A/B test or a t-test. This article covers the A/A test.
Should every team run an A/A test?
No. Run one when you adopt a tool or change how visitors are assigned or counted. If the setup is validated and each test checks its own split, you can skip it.
Sources
- Evan Miller, How Not To Run An A/B Test: 26.1% false-positive rate under continuous peeking; fixing the sample size in advance. Checked 2026-11-21.
- NIST/SEMATECH e-Handbook of Statistical Methods, 7.3.3 Comparing two proportions: the pooled-proportion z statistic used in the simulation. Checked 2026-11-21.
- NIST/SEMATECH e-Handbook, 1.3.5.15 Chi-square goodness-of-fit test: the statistic used for the sample ratio check. Checked 2026-11-21.
- Larsen et al., Statistical Challenges in Online Controlled Experiments: A Review of A/B Testing Methodology: A/A tests and sample ratio mismatch checks as platform data-quality checks. Checked 2026-11-21.
Was this article helpful?
We use your answers to fix and expand this page.
Couldn’t send. Please try again in a minute.
Thanks for the feedback. We’ll use it to improve this page.You’ve already sent feedback on this page. Thanks.

Product Experience Specialist
Writes about product experience, practical workflows, and growth, turning complex processes into clear steps for everyday decisions.