Try it on your own data
Every report in this article is in the free plan. One snippet for web and apps, up to 10 sites.
Start freeWhite label reporting means delivering client reports under your own brand instead of the analytics tool's. It is a five-level spectrum, not one switch: look (logo, colours), content (names, commentary), delivery (sender domain), access (link domain, login page) and ownership (who holds the data). Brand colours often fail contrast checks and unauthenticated email lands in spam, so check both.
What you will learn
- Pick the level per client first: cosmetic, content, delivery, access or ownership; a tool that brands only level 1 is often not enough
- Test brand colours as text: amber on white is 2.01:1 and fails; a darker shade of the same hue passes at 4.5:1 or more
- Publish SPF, DKIM and DMARC and count SPF lookups (limit 10) before reports go out under your domain
What is white label reporting?
White label reporting means delivering analytics reports to a client under your own brand instead of the brand of the tool that produced the numbers. The client sees your logo, your colours, your report title and your sender address; the tool is invisible. Agencies, consultants and freelancers use it because the report is the most visible thing they deliver each month, and it should look like their work.
"White label" is not one feature. It is a spectrum of five things, from cheap to hard:
- Cosmetic: logo, colours, fonts and the report title.
- Content: which metrics appear, what they are called, and the commentary around them.
- Delivery: who the email comes from and what domain the sender uses.
- Access: what domain the live link sits on, and whether the client sees the tool's login page.
- Ownership: who owns the data property and who can export it if the contract ends.
Most disappointment comes from buying a tool for level 1 and discovering the client's email still comes from the tool, or the link still shows the tool's name. This guide gives you a checklist for all five levels, a colour check you can recompute, the email settings that decide whether your reports reach an inbox, and a sample report outline. For what a monthly report should contain, see SEO analytics reporting.
The checklist of brandable elements
Use this table when you compare tools or plan a custom report. The last column says what you need to supply, because most of it is your own work and not a setting.
| Element | Level | What the client notices | What you need |
|---|---|---|---|
| Logo and colours | Cosmetic | Header and charts match your brand | Logo files, two or three hex colours |
| Fonts | Cosmetic | Reads as your document | Licensed web or PDF fonts |
| Report title and cover | Content | A named, dated report | Naming convention such as ClientName – Monthly Performance – 2026-11 |
| Metric names | Content | Terms they already use | A glossary mapping the tool's names to yours |
| Commentary | Content | What changed and what to do | A written summary per client, every period |
| Sender name and address | Delivery | Email arrives from reports@your-agency | A domain you control and DNS access |
| Email authentication | Delivery | The email reaches the inbox | SPF, DKIM and DMARC records (next sections) |
| Link domain | Access | The address is yours, not the tool's | A subdomain pointed at the tool, if it supports one |
| Login page | Access | No third-party sign-in screen | Read-only links without accounts |
| PDF footer and contact | Content | Who to ask about the numbers | Support address and escalation route |
| Data ownership | Ownership | The client owns their property | A contract clause and export rights |
Two rules save trouble. Decide how far you need to go for each client before you pick the tool: a freelancer sending a monthly PDF needs levels 1 and 2; an agency that offers a client portal needs levels 3 and 4. And put the ownership clause in the contract before the first report, not when the client leaves.
| Element | Level | What you need |
|---|---|---|
| Logo and colours | Cosmetic | Logo files, two or three tested hex colours |
| Report title and metric names | Content | Naming convention and a glossary of your terms |
| Sender name and address | Delivery | A domain you control and DNS access |
| Email authentication | Delivery | SPF, DKIM and DMARC records |
| Link domain and login page | Access | A subdomain, or read-only links without accounts |
| Data ownership | Ownership | A contract clause and export rights |
Full eleven-row checklist in the article. Authentication rules: Google email sender guidelines and RFC 7208, checked 2026-11-20.
Check that your brand colours are readable
Brand colours often fail as text colours. WCAG 2.2 success criterion 1.4.3 requires a contrast ratio of at least 4.5:1 for normal text and 3:1 for large text (18 point, or 14 point bold). A report that is hard to read in a boardroom or on a phone looks unprofessional however well it matches the logo.
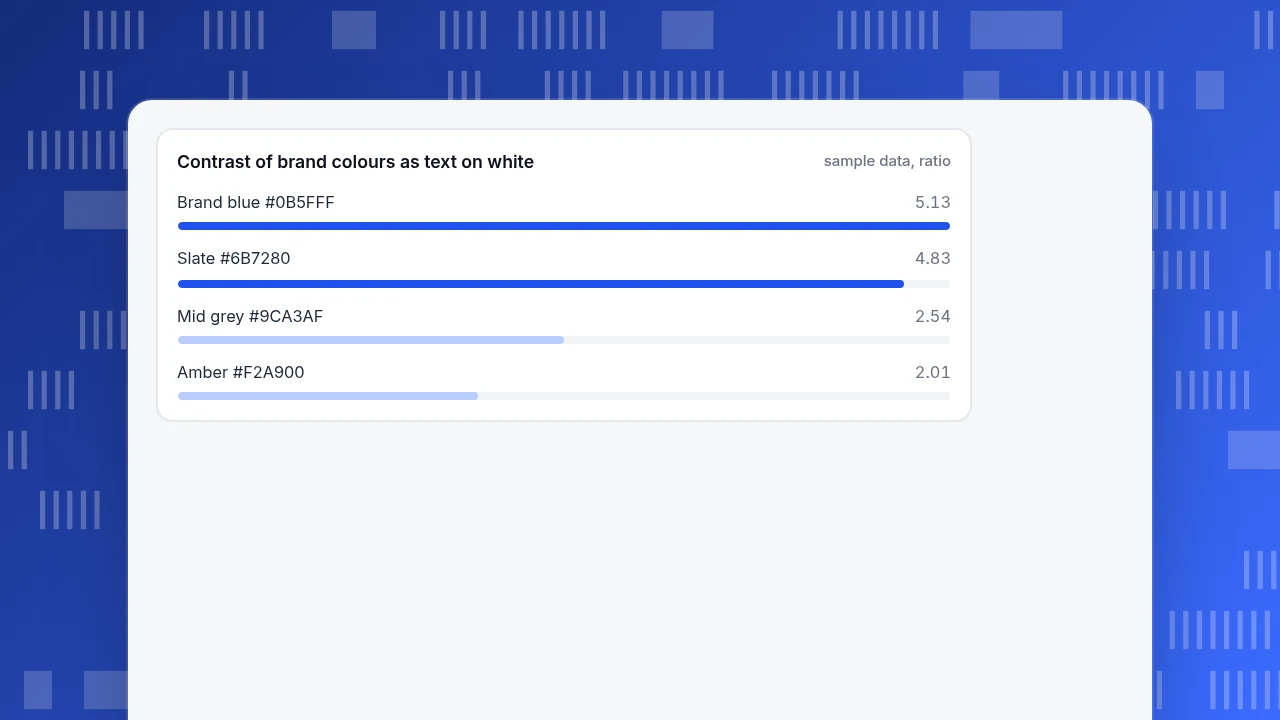
Sample data: four colours from a made-up brand palette, each tested as text on a white background. The ratios use the WCAG relative-luminance formula and were recomputed in Python.
| Colour | Hex | Contrast on white | Normal text (4.5:1) | Large text (3:1) |
|---|---|---|---|---|
| Amber | #F2A900 | 2.01:1 | Fails | Fails |
| Mid grey | #9CA3AF | 2.54:1 | Fails | Fails |
| Slate | #6B7280 | 4.83:1 | Passes | Passes |
| Brand blue | #0B5FFF | 5.13:1 | Passes | Passes |
The fix is not to drop the brand colour. Use the bright colour for fills, bars and accents, where it only needs to be distinguishable from its neighbours, and a darker shade of the same hue for text. Keep one text colour for body copy, one for headings, and test every pair before you build the template.
Contrast of brand colours as text on white
sample data, ratioMake the report email reach the inbox
If your reports are sent by email under your domain, three DNS records decide whether they arrive:
- SPF lets a domain owner publish which servers may send mail for it. RFC 7208 caps an SPF record at 10 terms that trigger a DNS lookup (
include,a,mx,ptr,existsandredirect); more than that returns a permanent error. - DKIM signs each message so the receiver can check it was not altered.
- DMARC tells receivers what to do when SPF or DKIM fails and requires the domain in the From address to align with one of them.
Google's email sender guidelines make these mandatory for anyone sending more than 5,000 messages a day to Gmail accounts (in force since February 1, 2024): publish SPF and DKIM, set up DMARC, keep the spam rate in Postmaster Tools under 0.30% (and ideally below 0.10%), and support one-click unsubscribe for marketing mail. A monthly client report is far below 5,000 messages, but the same records still decide whether the message lands in spam, so set them up anyway.
A check you can recompute: an agency's SPF record includes four sending services, plus a and mx. That is 4 + 1 + 1 = 6 lookup-triggering terms out of the 10 allowed, so there is room for four more tools. Adding a reporting tool, a newsletter service and a helpdesk (one term each) pushes it to 9; one more reaches 10, which is still allowed, and an eleventh returns a permanent error that can break authentication. Count before you add.
A sample client report outline
A white-labelled report is only as good as its content. This outline works for a one-to-three page monthly report:
- Headline (3 lines). Visitors, goal conversions and the main change versus last month, each with the comparison. Say whether the change is within normal variation.
- Targets (one table). Four to six metrics, each with last month, this month, target and status.
- What changed and why (half a page). The two biggest movers by source or page, with one sentence of cause each, and the dates of any launch or campaign that explains them.
- What we did (bullets). Work completed this month, each tied to a metric.
- What we recommend next (three items). Specific, with an owner and a date.
- Appendix: definitions. One line per metric: how it is counted, so the client does not compare it with a different tool's number.
Keep the data scope the client needs. A client rarely needs a visitor list, and sharing less is safer.
What branding saves: a time worked example
Sample data, with assumptions you should replace with your own: an agency with 12 clients sends 12 monthly reports a year. Building each report by hand from screenshots takes 25 minutes; filling a prepared template, with the numbers pulled by the same filters each month, takes 5.
- Manual: 12 clients × 12 months × 25 minutes = 3,600 minutes = 60 hours a year.
- Template: 12 × 12 × 5 = 720 minutes = 12 hours a year.
- Saved: 48 hours a year, before counting the time spent writing commentary, which is the part clients value.
The point is not the exact numbers. The point is that the template, the naming convention and the filters are where the hours go, and none of them depends on the tool having a white-label switch.
Setting up white label reporting in six steps
- Pick the level per client. Use the table above and write down the lowest level that satisfies the client.
- Inventory what each tool can brand. Ask for logo, colours, report title, sender domain, link domain and login page. If a tool cannot brand something, decide whether to work around it or to say so honestly.
- Build one template with fixed sections, a naming convention and tested colours.
- Fix the filters. Save the same date range, comparison and segments for every client, so a month-to-month number means the same thing.
- Set up delivery. Use a sender address on a domain you control, with SPF, DKIM and DMARC published, and send yourself a test.
- Review before sending. Check every number against the source, read the commentary as the client would, and keep a copy of what you sent.
White label reporting with TapCub
Be clear about what TapCub is in this picture. TapCub's documentation describes read-only sharing and scheduled delivery; it does not describe a custom logo, custom colours or a custom domain for shared pages or report emails, so do not plan on a fully white-labelled portal from TapCub alone. What it gives you is a clean source of numbers and ways to hand them to a client.
- Share a live view. Under Configuration › Settings › Public sharing, create a read-only link, optionally with a password. Choose the modules the client may see (overview, pages, sources, audience, bots) and cap how many days they can look back. The visitor list and sessions cannot be shared, which suits client reports. Step-by-step setup is in share a dashboard.
- Share a saved analysis or dashboard. In All-platform analytics › Overview › My dashboards, a dashboard share is read-only and its password can be left empty; shared analyses and dashboards show at most the last 90 days.
- Keep the numbers consistent. Set the same date range and previous-period comparison on every report page, and click a row such as a source to filter; the filter carries to related reports.
- Put the numbers in your own template. Table export gives CSV and XLSX (up to 50,000 rows at a time), and larger exports run from All-platform analytics › Data › Data export. Paste into the template from the previous section, where your logo, colours and commentary sit.
- Schedule the delivery. In Web analytics › Overview, the Subscribe action on a week, month or year row opens notification settings, where daily or weekly delivery is configured. Those emails come from TapCub, so send your own commentary email from your own domain alongside them.
TapCub does not brand the output for you. It measures and exports; the branding lives in your template.
FAQ
What is white label reporting?
It is delivering reports to a client under your own brand: your logo, colours, title and sender, instead of the analytics tool's. It ranges from cosmetic changes to a custom link domain and sender address, and the data ownership terms in your contract.
What can you white label in a client report?
Usually the logo, colours, fonts, title, cover, footer and contact details. Deeper levels are the sending email address and domain, the link domain and the login page. Check each tool for each item, because support varies.
Why do my report emails land in spam?
The most common reasons are missing or misaligned SPF, DKIM or DMARC records, or a spam rate that is too high. Google requires all three for senders above 5,000 messages a day, and the same records help smaller senders too.
Can I send a client a link instead of a PDF?
Yes. A read-only link with a password and a limited date range is easier to keep current than a PDF. Choose which modules are visible, and avoid sharing visitor-level data.
How many tools can I add to my SPF record?
SPF allows 10 terms that trigger a DNS lookup. Count each include, a, mx, ptr, exists and redirect; an include of a service that itself includes others also counts through the chain. More than 10 returns an error.
Sources
- W3C, WCAG 2.2: Understanding SC 1.4.3 Contrast (Minimum), checked 2026-11-20.
- Google, Email sender guidelines, checked 2026-11-20.
- IETF, RFC 7208: Sender Policy Framework, checked 2026-11-20.
Was this article helpful?
We use your answers to fix and expand this page.
Couldn’t send. Please try again in a minute.
Thanks for the feedback. We’ll use it to improve this page.You’ve already sent feedback on this page. Thanks.

Data Engineer
Writes about event design, data quality, and collection workflows, with verifiable implementation methods for reliable analytics.