Try it on your own data
Every report in this article is in the free plan. One snippet for web and apps, up to 10 sites.
Start freeMVP product development means building the smallest version that lets you learn whether people want the product, then measuring it against thresholds you set before you build. Track three numbers: activation, use of the core feature and week-1 return. They tell you whether to scale, iterate, pivot or stop.
What you will learn
- An MVP exists to start learning as quickly as possible, so the thresholds for success must be written before launch
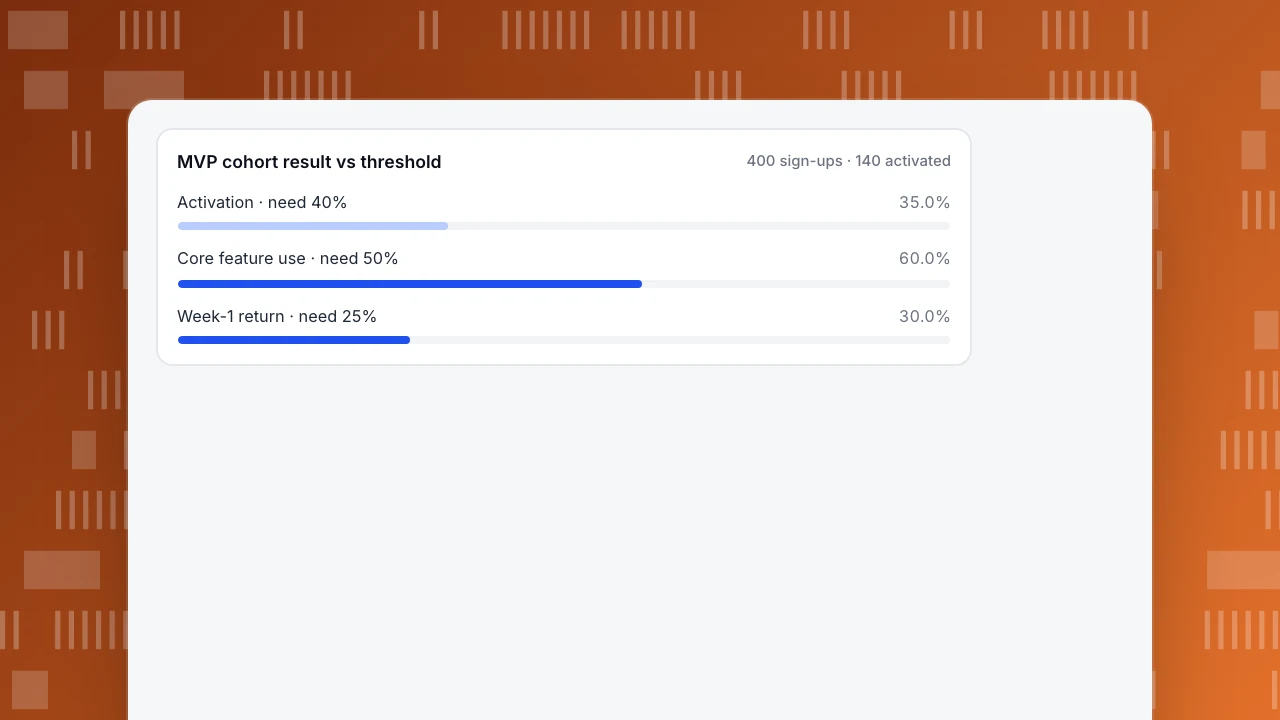
- In the sample, activation missed (35.0% vs 40%) with a conclusive band, feature use hit, and week-1 return was inconclusive with 140 activated users
- Decide on a date or a sample size in advance; about 323 activated users give a ±5 point band at 30%
What an MVP is for
The Lean Startup site describes the minimum viable product as the early version a team builds once it has identified the problem to solve, with one purpose: to begin the process of learning as quickly as possible. The loop it belongs to is build, measure, learn, and the decision at the end is to pivot or persevere. Two consequences follow:
- An MVP is a test, not a small launch. If you cannot say what result would make you change course, you are building a product, not an MVP.
- The measuring is part of the build. Metrics, thresholds and a date belong in the plan before the first line of code.
A seven-step process
- Name the problem and one assumption. For example, "freelancers will upload invoices if import takes under two minutes". One assumption per MVP.
- Choose the smallest test. A landing page with a waitlist, a concierge version run by hand, a clickable prototype or a thin coded version. Pick the cheapest one that can falsify the assumption.
- Pick three metrics and set thresholds. See the next section. Write them where the team can see them.
- Build only what the test needs. If a feature does not affect the three metrics, it waits.
- Instrument it. Send the events for sign-up, the activation action, the core feature and return visits, and check that they arrive before launch.
- Run it for a fixed window or sample. For example four weeks or 1,000 sign-ups, whichever comes first, with no changes except bug fixes.
- Read the result against the thresholds and decide. Use the decision table below. Write the decision down with the date.
Three metrics and thresholds set before you build
| Metric | Definition | Question it answers |
|---|---|---|
| Activation | Share of new users who complete the key action within 3 days | Do people get to the value? |
| Core feature use | Share of activated users who use the main feature at least once | Is the value in the part we built? |
| Week-1 return | Share of activated users who come back on days 7 to 13 | Does the need recur? |
Sample thresholds, set before launch: activation at least 40%, core feature use at least 50%, week-1 return at least 25%. These are examples; they are not benchmarks. Set yours from the assumption: how many people would have to do this for the business to work? Write the number down before you see data, or you will talk yourself into whichever number you get.
A worked result
Sample data: 400 users signed up in the test window.
| Step | Users | Rate | Threshold | Result |
|---|---|---|---|---|
| Activated within 3 days | 140 of 400 | 35.0% | 40% | Miss |
| Used the core feature | 84 of 140 | 60.0% | 50% | Hit |
| Returned on days 7 to 13 | 42 of 140 | 30.0% | 25% | Hit? |
Taken at face value, two of three pass. Whether that is true depends on how certain each result is.
MVP cohort result vs threshold
400 sign-ups · 140 activatedIs the result conclusive?
A rate measured on n users has a rough 95% band of 1.96 × √(p(1−p) ÷ n):
| Metric | n | Rate | Band | Against threshold |
|---|---|---|---|---|
| Activation | 400 | 35.0% | 30.3% to 39.7% | Entirely below 40%: a real miss |
| Core feature use | 140 | 60.0% | 51.9% to 68.1% | Entirely above 50%: a real hit |
| Week-1 return | 140 | 30.0% | 22.4% to 37.6% | Straddles 25%: inconclusive |
So activation is a conclusive miss, feature use a conclusive hit, and week-1 return needs more data. For a band of ±5 points at 30% you need n = 1.96² × 0.30 × 0.70 ÷ 0.05² ≈ 323 activated users. At 35% activation that is about 923 sign-ups (323 ÷ 0.35). Decide in advance how many users the test needs, and do not read results earlier.
This is a rule of thumb for independent users, not a significance test; for a small MVP it is enough to stop you reading noise as a verdict.
Decide: scale, iterate, pivot or stop
| Activation | Core feature use | Week-1 return | Decision |
|---|---|---|---|
| Hit | Hit | Hit | Scale: widen the cohort and acquisition |
| Miss | Hit | Hit | Iterate onboarding: people who get in value it |
| Hit | Miss | Any | Iterate the product: people arrive but do not find the value |
| Hit | Hit | Miss | Check how often the need arises; consider a different use case |
| Miss | Miss | Miss | Pivot the problem or stop |
The sample falls into row 2, with the return result still to be confirmed: iterate onboarding. The people who got in used the core feature, so the product is probably not the problem; the path to the first value is. Run the next cohort with a shorter path, keep the thresholds and extend the window until you have about 323 activated users.
| Activation | Core feature use | Week-1 return | Decision |
|---|---|---|---|
| Hit | Hit | Hit | Scale: widen the cohort and acquisition |
| Miss | Hit | Hit | Iterate onboarding: people who get in value it |
| Hit | Miss | Any | Iterate the product: people arrive but do not find the value |
| Hit | Hit | Miss | Check how often the need arises; consider a different use case |
| Miss | Miss | Miss | Pivot the problem or stop |
Hit and miss are against thresholds set before launch. Treat a result as hit or miss only if its 95% band clears the threshold.
Time-box the whole thing
Every MVP needs a stop rule, because there is always one more feature to add. Pick one of these before you start:
- A date: four weeks after launch.
- A sample: 1,000 sign-ups or 323 activated users.
- A count of iterations: at most three rounds on the same assumption.
If three rounds on one assumption do not move the metric that missed, pivot to a different problem or stop. That is a result too, and it costs far less than a year of building.
Choose the smallest test that can fail
Step 2 of the process is the choice most teams get wrong, usually by building too much. Match the test to the assumption.
| Test | What it can tell you | What it cannot tell you | Sample effort |
|---|---|---|---|
| Landing page with a waitlist | Whether the promise attracts sign-ups | Whether people use the product | 2 days |
| Concierge: you deliver the service by hand | Whether the outcome is valuable, and how often people ask | Whether software can do it at scale | 1 week |
| Clickable prototype | Whether the flow is understood | Whether people return | 1 week |
| Thin coded version | Activation, use and return with real behavior | Anything outside the core assumption | 4 to 6 weeks |
The effort column is a sample, not a benchmark. The rule is to pick the cheapest row whose "can tell you" covers the assumption you wrote in step 1. If the assumption is "freelancers will pay to save two hours a week on invoices", a landing page cannot test it, but a concierge version can: you do the invoices by hand for ten freelancers and see whether they come back next week.
Two mistakes recur:
- Building the second feature. If a feature does not affect activation, core use or return, it is not in the MVP.
- Testing with friends. Early users who know you will say what you want to hear. Recruit strangers from the channel you would use at scale.
What not to conclude from an MVP
An MVP result is narrow. Keep these limits in view:
- A small cohort says little about the market. 400 sign-ups from one channel describe that channel.
- A hit is not proof of a business. It shows people use the product, not that they will pay or that acquisition is affordable.
- A miss may be a weak test. If the install flow broke, activation tells you about the bug. Check errors and the funnel by step before you conclude.
- Early users differ from later ones. Retention often falls as you move from enthusiasts to the general public.
For each result, write what it does and does not prove in one sentence next to the decision. That sentence is what you will want when someone asks six months later why you pivoted.
A one-page MVP plan
Write this on one page before you build and keep it where the team sees it. Sample entries for the invoice example:
| Field | Entry |
|---|---|
| Problem | Freelancers lose about two hours a week on invoices |
| Assumption | They will upload invoices if import takes under two minutes |
| Test | Thin coded version, invite-only, 4 weeks or 1,000 sign-ups |
| Activation | Uploaded one invoice within 3 days; threshold 40% |
| Core feature use | Used auto-reminders at least once; threshold 50% of activated |
| Week-1 return | Active on days 7 to 13; threshold 25% of activated |
| Sample needed | About 323 activated users for a ±5 point band at 30% |
| Decision rule | Table above; three rounds at most on this assumption |
| Owner and date | One name; decision meeting on a fixed date |
The page does three jobs. It stops the scope from growing, because every feature must connect to a row. It protects the team from moving the goalposts after the data arrives. And it gives you a record of what you expected, so the next MVP starts with a better guess.
How to measure an MVP in TapCub
Use the 400-user cohort above.
- In All-platform analytics › Data › Tracking plan, list the events you plan to send (sign-up, activation action, core feature, return) with owner and status. Turn on live validation (the last 24 hours) to see that each event arrives and its required properties are present before you launch.
- In All-platform analytics › Behavior › Behavior analysis, build a funnel from sign-up to the activation action and read the rate against your 40% threshold.
- In the same place, use retention to see whether activated users return in the next periods; compare cohorts launched with different onboarding.
- In All-platform analytics › Users › Segments & tags, save "activated" and "used the core feature" as segments, and use them in funnels and retention.
- If users sign in, call
tapcub.loginso each person has one profile with a day-by-day timeline, and talk to the activated ones using Live chat, where the conversation arrives with the page and the person.
TapCub does not run surveys, A/B tests or feature flags. It measures the three metrics and shows who did what; deciding is still your job, against thresholds you wrote down.
FAQ
What is MVP product development?
It is building the smallest version of a product that lets you learn whether people want it, measured against thresholds set before launch. The goal is learning, not a small launch.
What metrics should I track for an MVP?
Three are enough: activation (reaching the key action), core feature use (using the part you built) and week-1 return (coming back). Set thresholds for each before you build.
How many users do I need to validate an MVP?
Enough to make the band narrow: about 323 activated users for ±5 points at a 30% rate. With fewer, a result is a hint, not a verdict. Fix the number before you launch.
When should I pivot instead of iterate?
Iterate when one metric misses and the others pass. Pivot when all three miss, or when three rounds on the same assumption do not move the metric that missed.
What is the difference between an MVP and a prototype?
A prototype shows what something could look like or do; an MVP is used by real people so you can measure behaviour. Some MVPs are prototypes or hand-run services, as long as people really use them.
Sources
- The Lean Startup: Principles
- Internal: MVP test and minimum viable product
Was this article helpful?
We use your answers to fix and expand this page.
Couldn’t send. Please try again in a minute.
Thanks for the feedback. We’ll use it to improve this page.You’ve already sent feedback on this page. Thanks.

Product Experience Specialist
Writes about product experience, practical workflows, and growth, turning complex processes into clear steps for everyday decisions.