Try it on your own data
Every report in this article is in the free plan. One snippet for web and apps, up to 10 sites.
Start freeA website evaluation is most useful as a scorecard of measurements rather than opinions: real visitors, engagement, speed, conversion and trust basics, each scored 0 to 2 against a published standard or your own 90-day median. This guide scores 15 metrics for a maximum of 30, works through one sample site that scores 18 of 30 (60%), and shows how to find the weakest area and fix it first.
What you will learn
- Score against external standards where they exist (Core Web Vitals, WCAG contrast) and your own 90-day median elsewhere
- Use one rule: 2 = meets or beats, 1 = within 10%, 0 = worse by more than 10%
- Read the lowest area, not only the total: four full areas and zero conversion still totals 80%
Why score a website with numbers instead of opinions?
Most website evaluation checklists ask whether the design looks modern or the copy is clear. Those are opinions, and two reviewers will disagree. A scorecard replaces them with measurements that any two people can reproduce: how many real visitors arrive, whether they engage, how fast the pages load, how many convert and whether the basics of trust are in place. It also tells you where to start, because the weakest area is where effort pays most.
This guide scores 15 metrics in five areas, each 0 to 2, for a maximum of 30. Two kinds of threshold are used:
- External standards where they exist: Google's Core Web Vitals thresholds from web.dev and the WCAG text-contrast minimum.
- Your own baseline where no universal number exists. Conversion rate, bounce rate and pages per session vary so much by site type that a "good" figure from elsewhere is misleading. Instead, score against the median of your last 90 days.
The scoring rule is the same throughout: 2 = meets the standard or beats your median; 1 = within 10% of it; 0 = worse by more than 10%. The band cut-offs at the end are our own convention, a starting point rather than an industry standard. For a wider audit of the tracking itself, see web analytics audit; for outside reference points, see website benchmarks.
What does the scorecard measure?
| Area | Metric | How to score |
|---|---|---|
| Traffic | Human visitors, last 28 days vs previous 28 | 2 if flat or up, 1 if down under 10%, 0 if down more |
| Traffic | Share of sessions with a named source or campaign | Own median |
| Traffic | Share of the largest single source (concentration) | Own median, lower is better |
| Engagement | Bounce rate | Own median, lower is better |
| Engagement | Pages per session (pageviews ÷ sessions) | Own median |
| Engagement | Average visit duration | Own median |
| Speed | LCP at the 75th percentile | 2.5 s or less = 2 |
| Speed | INP at the 75th percentile | 200 ms or less = 2 |
| Speed | CLS at the 75th percentile | 0.1 or less = 2 |
| Conversion | Conversion rate (conversions ÷ sessions) | Own median |
| Conversion | Mobile conversion rate ÷ desktop conversion rate | Own median |
| Conversion | Drop-off at the worst funnel step | Own median, lower is better |
| Trust | Error rate (errors ÷ pageviews) | Own median, lower is better |
| Trust | Share of your top 10 pages with text contrast of at least 4.5:1 | 10 of 10 = 2, 9 = 1, 8 or fewer = 0 |
| Trust | HTTPS on every page | Yes = 2, any mixed page = 0 |
Three notes on the choices:
- Core Web Vitals are assessed at the 75th percentile of page loads, separately for mobile and desktop, and a page passes only if all three meet their targets. Use real-user data, not a single lab run. Thresholds: LCP 2.5 seconds, INP 200 milliseconds, CLS 0.1.
- Contrast follows WCAG 2.2 success criterion 1.4.3: at least 4.5:1 for normal text and 3:1 for large text (18 point, or 14 point bold). Check with any contrast tool; it is a design check, not an analytics number.
- Own median means the median of the last 90 days of the same metric on the same site, so you are scoring against what normal looks like for you.
Worked example: scoring one site
Sample data: one site, last 28 days.
| Metric | Value | Reference | Points |
|---|---|---|---|
| Human visitors vs previous 28 days | +4% | Flat or up | 2 |
| Sessions with a named source | 62% | Median 60% | 2 |
| Largest source share | 48% | Median 45% (lower better; 6.7% worse) | 1 |
| Bounce rate | 41% | Median 40% (lower better; 2.5% worse) | 1 |
| Pages per session | 2.4 | Median 2.3 | 2 |
| Average visit duration | 112 s | Median 118 s (5.1% lower) | 1 |
| LCP p75 | 2.3 s | 2.5 s | 2 |
| INP p75 | 240 ms | 200 ms (20% over) | 0 |
| CLS p75 | 0.08 | 0.1 | 2 |
| Conversion rate | 2.1% | Median 2.5% (16% lower) | 0 |
| Mobile ÷ desktop conversion | 0.55 | Median 0.60 (8.3% lower) | 1 |
| Worst funnel step drop | 30% | Median 26% (15% worse) | 0 |
| Error rate | 0.30% | Median 0.35% | 2 |
| Top pages with contrast ≥ 4.5:1 | 8 of 10 | 10 of 10 | 0 |
| HTTPS everywhere | Yes | Yes | 2 |
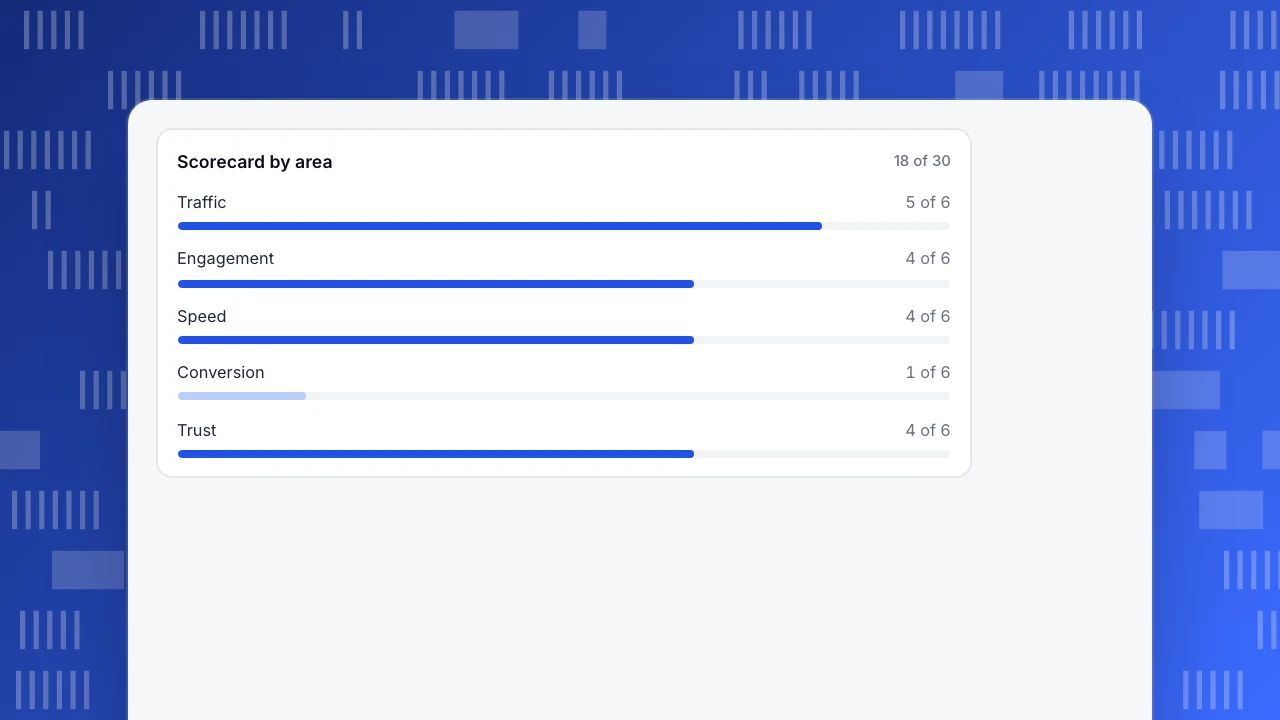
Totals by area: Traffic 2 + 2 + 1 = 5 of 6; Engagement 1 + 2 + 1 = 4 of 6; Speed 2 + 0 + 2 = 4 of 6; Conversion 0 + 1 + 0 = 1 of 6; Trust 2 + 0 + 2 = 4 of 6. Overall 18 of 30, or 60%.
Scorecard by area
18 of 30How do you read the total?
| Score | Band | What to do |
|---|---|---|
| 80% or more (24+ of 30) | Healthy | Maintain; look at the single lowest metric each quarter |
| 60% to 79% (18–23) | Targeted fixes | Fix the lowest area first |
| Under 60% (below 18) | Fix before spending on traffic | More visitors will mostly add to the problem |
The sample site sits at the bottom of the middle band, so the answer is targeted fixes, and the area to fix is obvious: conversion scored 1 of 6 while the others scored 4 or 5. The smallest-effort fix on the list is probably the pair that is clearest in the data: INP of 240 ms (20% over its threshold) and the worst funnel step losing 30% of people.
Do not rely on the total alone. A site with full marks in four areas and 0 of 6 on conversion still totals 80% and reads as healthy while it converts almost nobody; look at the lowest area, not only the total.
| Total | Band | What to do |
|---|---|---|
| 80% or more (24+) | Healthy | Maintain; review the lowest metric each quarter |
| 60% to 79% (18–23) | Targeted fixes | Fix the lowest area first |
| Under 60% (below 18) | Fix before buying traffic | More visitors will mostly add to the problem |
The bands are our own convention, a starting point rather than an industry standard.
What do you do with each failing metric?
- Visitors down: check sources first. A fall in one channel, with the others flat, is a channel problem; a fall everywhere is a measurement or site problem (bots excluded, tag removed).
- High concentration: a single source above half of sessions is a dependency. Add a second channel before the first changes its rules.
- Bounce or duration worse than baseline: look at the landing pages with the most entries, not the site average.
- INP or LCP failing: find the pages with the most sessions and the worst numbers; fix those first.
- CLS failing: usually images, ads or embeds without reserved space.
- Conversion low: open the funnel, find the step with the largest drop and look at the people who drop there before changing anything.
- Mobile ÷ desktop ratio low: test the form and checkout on a phone; the problem is usually layout or input, not intent.
- Contrast below 4.5:1: change the colour token, not each page.
A 30-minute routine for repeating the evaluation
- Minutes 0 to 5: export or copy the 15 values for the last 28 days into the sheet, with the date.
- Minutes 5 to 10: update each metric's 90-day median and mark any metric that changed definition since last time.
- Minutes 10 to 20: score every line with the 2, 1, 0 rule and total each area.
- Minutes 20 to 30: pick the single lowest area, write one change for it with an owner and a date, and note the metric that will show whether it worked.
Repeat quarterly. After a redesign, run it once the week before launch and once four weeks after, so the comparison uses the same 28-day length.
Common mistakes in a website evaluation
- Scoring against someone else's benchmark. A shop and a documentation site cannot share a bounce-rate target.
- Using one lab test for speed. Real-user p75 over a period is what the standard describes.
- Counting bots as visitors. They raise traffic and lower every rate.
- Evaluating after a change without a baseline. Record the median before you redesign.
- Treating the total as the finding. The lowest area is the finding.
- Scoring on tiny traffic. With a few hundred sessions a month, medians swing; evaluate quarterly instead.
Pulling the scorecard from TapCub
Take the sample site. You want to fill every line without opening six tools.
- Traffic and engagement. Web analytics › Overview has visitors and the headline rates; Web analytics › Sources gives named source and campaign share and the biggest source; Web analytics › Pages gives pageviews by page for pages per session.
- Speed. Monitoring › Performance shows real-user Core Web Vitals, which is what the 75th-percentile thresholds refer to.
- Conversion. Define the goal in Web analytics › Goals, then build a funnel in All-platform analytics › Behavior › Behavior analysis; the largest drop is marked and the step table gives drop-off and median time.
- Quality. Monitoring › Errors gives the error rate (errors ÷ pageviews) with affected sessions.
- Keep it honest and watching. Web analytics › Bots keeps bots out of the visitor base. In All-platform analytics › Operations › Monitors you can set a threshold on built-in metrics such as bounce rate, average duration and error rate, run it as a dry run first to see how often it would have fired over the past 30 days, and be notified when it fires.
Know the boundary: TapCub does not audit design, text contrast or HTTPS. Those lines come from a browser or accessibility tool, and the scoring stays in your own sheet.
FAQ
What should a website evaluation include?
Traffic (real visitors and where they come from), engagement (bounce, pages per session, duration), speed and stability (Core Web Vitals at the 75th percentile), conversion (rate, mobile gap, worst funnel step) and trust basics (errors, text contrast, HTTPS).
How do you evaluate a website's performance?
Use real-user data: LCP 2.5 seconds or less, INP 200 milliseconds or less and CLS 0.1 or less at the 75th percentile of page loads, assessed separately for mobile and desktop. A page passes only if all three meet their targets.
What is a good bounce rate or conversion rate for a website?
It depends on site type, so a single figure from elsewhere misleads. Score against the median of your own last 90 days: beat it for full points, stay within 10% for half, fall further behind for none.
How often should you evaluate your website?
Quarterly for most sites, or after any redesign or tracking change, with the previous median recorded beforehand. Sites with only a few hundred sessions a month should avoid weekly scoring because medians swing too much.
What is the minimum text contrast for accessibility?
WCAG 2.2 success criterion 1.4.3 requires at least 4.5:1 for normal text and 3:1 for large text, which is 18 point or 14 point bold.
Sources
- web.dev. Web Vitals. LCP 2.5 s, INP 200 ms, CLS 0.1 at the 75th percentile of page loads, mobile and desktop separately. Checked 2026-11-21.
- W3C. Understanding Success Criterion 1.4.3: Contrast (Minimum). 4.5:1 normal text, 3:1 large text (18 point or 14 point bold). Checked 2026-11-21.
- Google Analytics Help. [[GA4] Engagement rate and bounce rate](https://support.google.com/analytics/answer/12195621). Engaged session and bounce rate definitions. Checked 2026-11-21.
Was this article helpful?
We use your answers to fix and expand this page.
Couldn’t send. Please try again in a minute.
Thanks for the feedback. We’ll use it to improve this page.You’ve already sent feedback on this page. Thanks.

Data Engineer
Writes about event design, data quality, and collection workflows, with verifiable implementation methods for reliable analytics.