Try it on your own data
Every report in this article is in the free plan. One snippet for web and apps, up to 10 sites.
Start freeWeb traffic monitoring means comparing visits with an expected level and being alerted when they leave it, instead of reading totals. The expected level is usually the same weekday in recent weeks, and the alert should need two things at once: a value outside the statistical band and a change big enough to matter, such as a drop of at least 20%. In the sample week below, that rule fires once, on the real incident, not twice.
What you will learn
- A total means nothing without a baseline; use the same weekday in recent weeks, not yesterday
- A sigma band alone false-alarms on short history; combine it with a minimum percent change
- Add a no-data gap alert, because no traffic band catches a broken tracking script
What is web traffic monitoring, and how is it different from checking totals?
Web traffic monitoring means watching visits continuously against an expected level, and being told when the number leaves that level, instead of opening a report and looking at the total. A total of 1,097 sessions on a Friday tells you nothing until you know whether Fridays usually bring 1,100 or 1,900. Monitoring adds the two things a total lacks: a baseline (what is normal for this day) and a rule (how far from normal is worth a message).
That is also what separates monitoring from website traffic analysis. Analysis asks why traffic changed and takes time. Monitoring asks whether something changed, quickly and cheaply, so that a tracking break, a broken campaign link or a bot spike is found the same day rather than at the monthly review. If you want the broader question of whether the site itself is up and fast, that is website monitoring; this article is about the visitor numbers.
What should you watch?
Six signals cover most real incidents. Each has a natural rule type.
| Signal | What it catches | Good rule | Check every |
|---|---|---|---|
| Sessions or visitors | Outages, broken campaign links, ranking loss | Compare with same weekday in earlier weeks | Day (hour for large sites) |
| No data at all | Tracking script removed or blocked | Gap with no events longer than N minutes | Minutes to hours |
| Error rate | A release that broke a page | Fixed ceiling, such as above 2% of pageviews | Hour |
| Bounce rate or engagement | A landing page or ad sending the wrong visitors | Percent change against previous period | Day |
| Top source share | One channel stopping or one source flooding | Share of sessions from a source versus its normal share | Day |
| Bot share | Crawler or scraper surges inflating totals | Bots counted separately; alert on their request count | Day |
Do not alert on everything. Two or three monitors that nobody ignores are worth more than twenty that train people to mute the channel. A useful test for any monitor: if it fires at 3 a.m., is there an action someone would take before morning? If not, make it a daily summary instead.
| Signal | Good rule | Check every |
|---|---|---|
| Sessions or visitors | Same weekday in earlier weeks | Day |
| No data at all | Gap longer than N minutes | Minutes to hours |
| Error rate | Fixed ceiling | Hour |
| Bounce or engagement | Percent change vs previous period | Day |
| Top source share | Share vs its normal share | Day |
| Bot share | Alert on bot request count | Day |
Two or three monitors that nobody mutes beat twenty that everybody does.
How do you build a baseline that respects weekly rhythm?
Most sites are not flat. Many have a strong weekday pattern: business tools drop at the weekend, consumer sites rise. Comparing Saturday with Friday guarantees a false alarm every week. The simplest sound baseline compares each day with the same weekday in recent weeks.
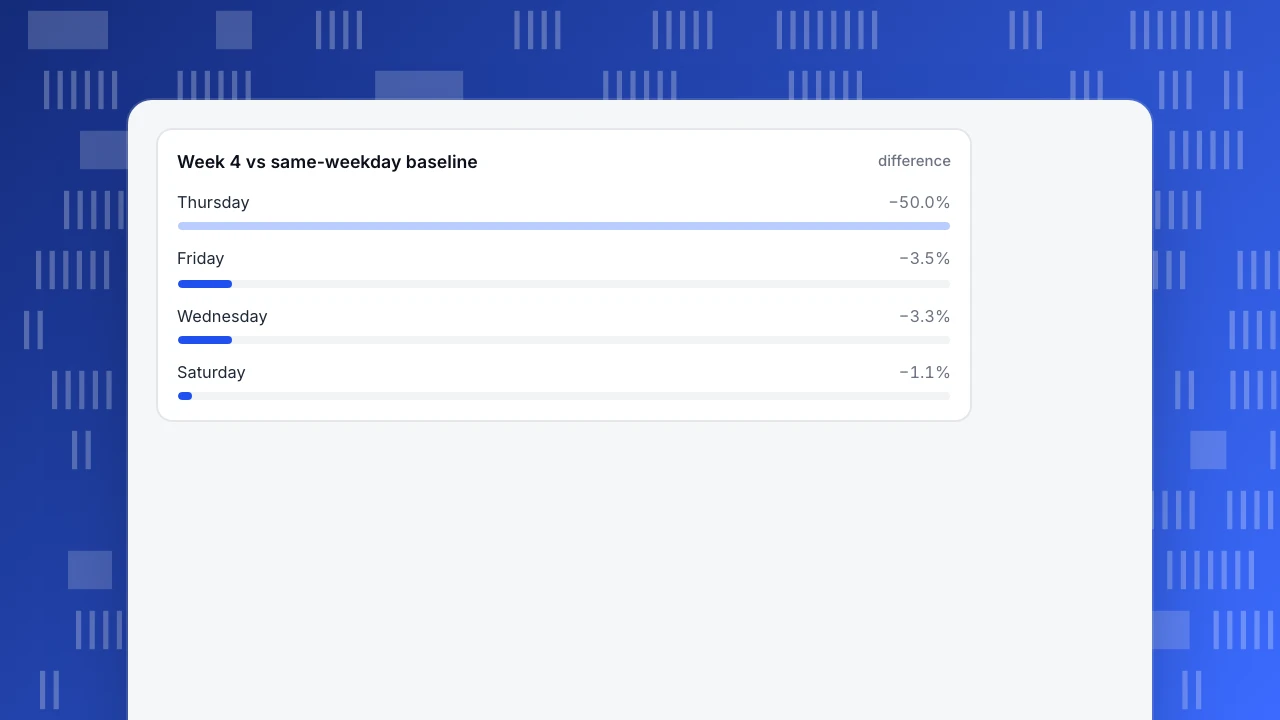
Sample data: daily sessions for a site with roughly 1,150 weekday and 700 weekend sessions. The fourth week is the week we monitor, and the baseline for each day is the mean of the same weekday over the previous three weeks.
| Day (week 4) | Sessions | 3-week same-weekday mean | Difference | Mean minus 3 standard deviations |
|---|---|---|---|---|
| Mon | 1,215 | 1,154.3 | +5.3% | 1,073.3 |
| Tue | 1,262 | 1,157.3 | +9.0% | 1,116.6 |
| Wed | 1,165 | 1,205.0 | −3.3% | 1,152.7 |
| Thu | 610 | 1,219.7 | −50.0% | 992.8 |
| Fri | 1,097 | 1,136.7 | −3.5% | 1,025.5 |
| Sat | 703 | 710.7 | −1.1% | 703.1 |
| Sun | 716 | 699.7 | +2.3% | 577.1 |
How to recompute: take the same weekday from weeks 1, 2 and 3, average them (Thursday: 1,176, 1,176 and 1,307 average 1,219.7, with a standard deviation of 75.6), subtract the baseline from the actual, divide by the baseline. Thursday's drop is (610 − 1,219.7) ÷ 1,219.7 = −50.0%, and 610 is far below the 992.8 lower limit. That is a real incident, and the only one in the week.
Notice Saturday, though. Its three previous Saturdays (708, 713 and 711) were almost identical, with a standard deviation of 2.5, so the lower limit sits at 703.1 and Saturday's 703 falls 0.1 under it. A rule based only on standard deviations would fire on a day that is 1.1% below normal. This is the main weakness of statistical bands on short history, and the next section fixes it.
Week 4 vs same-weekday baseline
differenceWhen should an alert fire?
Pick the rule type by how much history you have and how steady the metric is.
- Fixed threshold. "Errors above 2% of pageviews." Works for metrics with a natural ceiling or floor. Needs no history.
- Percent change. "Sessions down more than 20% versus the same day last week." Simple and explainable. Over-fires on small sites where a few visits swing the percentage.
- Statistical band. "Below the same-weekday mean minus 3 standard deviations." Adapts to each metric's own noise. In process control, three-sigma limits are the accepted standard: for normally distributed data about 0.3% of points fall outside them, which is a false alarm roughly once in 371 points (NIST/SEMATECH e-Handbook of Statistical Methods, section 6.3.2, checked 2026-11-21). That figure assumes the average and spread are known. With only three weeks of history they are estimates, so real false-alarm rates are higher, as Saturday shows.
- Combined rule. Fire only when the value is outside the band and the change is large enough to matter, for example a drop of at least 20%.
Applied to the sample week: band alone fires on Thursday and Saturday. The combined rule (below the band and down at least 20%) fires only on Thursday. Saturday is 1.1% below its baseline, which no one would act on.
Three practical settings keep alerts trustworthy. First, require history: with fewer than about 4 same-weekday points, use a fixed threshold or percent change instead of a band. Second, add a small-volume floor, such as ignore percent changes when the baseline is under 100 sessions. Third, avoid repeats: one incident should produce one message, then a quiet period, not a message every hour.
How do you separate real traffic changes from noise you can explain?
Before reacting to an alert, rule out the explanations that are not incidents:
- A campaign ended or an email went out. Annotate launches, sends and releases on the chart so the spike has a label when someone looks next month.
- A holiday. Same-weekday baselines misfire on holidays. Add the date to a list or mute the monitor for the day.
- Bots. A surge from crawlers inflates sessions without a single extra human. Look at human and bot traffic separately before concluding anything.
- Tracking itself. A sudden drop to a flat near-zero line is a tracking break, not a demand drop. A cliff in all countries and all sources at the same minute is almost always the script, a consent banner change or a deploy.
- Time zone and reporting delay. Some data arrives late. Compare complete days, and give app or server data time to land.
A fast triage order is: is data arriving at all, then is it bots, then is it one source, one country or one device, then is it a real change in demand. Each step is one chart.
How do you set this up in TapCub?
Take the Thursday drop above and watch for it automatically.
- Open All-platform analytics › Operations › Monitors and create a monitor on the built-in
sessionsmeasure (the built-ins arepv,uv,sessions,bounce_rate,avg_duration,error_rateanderrors), on a day grain. - Choose the condition. Anomaly compares the value with the mean and spread of the same weekday over 28 days, needs about 30 days of data by default, and has a confidence setting from 70 to 99; higher confidence widens the band. Forecast band compares with the mean of the last 7 days and the same weekday, is skipped until there are 14 days of history, and offers strict (about ±10%), medium (about ±30%) and loose (about ±50%) bands. Period change fires when the percent change against the previous period crosses the figure you enter.
- Add a second monitor for the failure no band catches: the Collection gap condition fires when there are no events for longer than the number of minutes you set. That is your tracking-break alarm.
- Run a dry run before saving. It calculates only, sends nothing, and reports how many times the last 30 days would have fired. If it says 11 for a monitor you want weekly, the rule is too tight.
- Pick channels. If you choose none, every enabled channel is used; channels are email, WeCom, DingTalk, Feishu and webhook. A notification is not repeated for about 60 minutes by default, and three hits in a row pause the rule.
TapCub monitors notify; they do not change anything or take action for you. When an alert fires, open Web analytics › Realtime and Web analytics › Bots to check whether the change is human, and use the annotations on the chart to mark the cause once you know it.
What mistakes make traffic monitoring noisy?
- Comparing with yesterday. On a site with a weekend dip, Monday always looks like a surge.
- Alerting on the total only. A drop in one country or channel hides inside a stable total. Add one monitor per channel that matters.
- Using a band with too little history. As the Saturday row shows, a tight band fires on a 1.1% wobble.
- Never reviewing monitors. Look at fired alerts monthly. Any monitor that fired five times without an action should be loosened or turned into a summary.
- No owner. An alert that goes to a shared channel and belongs to nobody is read by nobody. Name one person per monitor.
FAQ
What is web traffic monitoring?
It is the continuous comparison of visits against an expected level, with a notification when they leave it. The expected level, the baseline, is usually the same weekday in recent weeks. The aim is to catch tracking breaks, outages, broken links and bot surges the same day instead of at the next report review.
How do I monitor traffic to my website?
Choose two or three measures, such as sessions and error rate, and create a monitor for each on a day or hour grain. Use a same-weekday baseline for visitors, a fixed ceiling for errors, and a no-data gap for tracking breaks. Test each rule on the last 30 days before enabling it.
What threshold should I use for a traffic drop alert?
A common starting point is a drop of at least 20% against the same-weekday baseline, combined with a statistical band such as the mean minus three standard deviations. The percent change stops tiny wobbles from firing, and the band stops noisy days from firing too often. Adjust after reviewing a month of alerts.
How many days of history do I need?
For a same-weekday band, about four weeks, so each weekday has at least four points. With less, use a fixed threshold or a percent change. Some tools skip band rules until they have 14 days, and an anomaly rule over 28 days of same-weekday data needs about 30 days.
What is the difference between a traffic spike and a bot spike?
A traffic spike from people comes with matching sessions, engaged visits and, usually, conversions. A bot spike inflates requests or sessions from a handful of sources with near-zero engagement. Look at human and bot traffic separately before acting on either.
Sources
- NIST/SEMATECH e-Handbook of Statistical Methods: What are Shewhart control charts?, checked 2026-11-21
- Google Analytics Help: Insights and custom insights, checked 2026-11-21
Was this article helpful?
We use your answers to fix and expand this page.
Couldn’t send. Please try again in a minute.
Thanks for the feedback. We’ll use it to improve this page.You’ve already sent feedback on this page. Thanks.

Data Engineer
Writes about event design, data quality, and collection workflows, with verifiable implementation methods for reliable analytics.