Try it on your own data
Every report in this article is in the free plan. One snippet for web and apps, up to 10 sites.
Start freeWeb analytics terms are names for rules, and the rule behind each name has to be written down. This glossary groups the terms by the question they answer: who arrived (users, sessions, source), what they did (engagement rate, bounce), what they achieved (conversion rate, funnel), how the site behaved (Core Web Vitals, error rate) and what the data is made of. Every ratio is computed from one sample week.
What you will learn
- A term names a rule: engaged session, session timeout and conversion base all need writing down
- Always say whether a rate is per session or per user: 2.5% and 2.97% describe the same traffic
- Do not compare a number across tools until the definitions are aligned
Why the same term means different things in different tools
Most web analytics terms look obvious, and most of them hide a choice. "Bounce rate" is a good example. In Google Analytics 4 an engaged session is one that lasts longer than 10 seconds, has a key event, or has at least two page or screen views; engagement rate is engaged sessions divided by sessions, and bounce rate is the inverse, the percentage of sessions that were not engaged. In older tools a bounce meant a single-page visit. A visitor who reads one article for four minutes was a bounce in the old definition and an engaged session in the new one.
The same applies to sessions. GA4 ends a session after 30 minutes of inactivity by default, with no cap on how long it can run; other tools may use a different timeout. So the first rule for the glossary below: a term is a name for a rule, and the rule has to be written down. Each entry gives the usual definition, the formula where one exists and the choice to check.
Traffic terms: who arrived and from where
| Term | Plain definition | Choice to check |
|---|---|---|
| Visitor or user | A person, counted by a browser or device identifier or, after login, a user ID | One person on two devices is two visitors unless logged in |
| Session | A group of interactions by one visitor that ends after a period of inactivity | The timeout (30 minutes is common) |
| Pageview | One load of a page | Single-page apps need a pageview event on route change |
| Referrer | The page that sent the visitor, as reported by the browser | Often blank or trimmed to the domain |
| Source / medium | Where the visit came from (domain or campaign name) and the kind of channel (organic, email, referral) | Channel grouping rules differ by tool |
| UTM parameters | Tags you add to a link (utm_source, utm_medium, utm_campaign) so the visit is named | Inconsistent capitalisation splits one campaign into several rows. See UTM |
| Direct | Visits with no referrer and no campaign tag | A catch-all, not proof that people typed the address |
| Bot traffic | Requests from crawlers, monitors and AI agents | Whether bots are counted in visitors or kept separate |
Sessions per user is the quickest sanity check on the first two rows: 10,000 sessions from 7,400 users is 1.35 sessions each. Track it week to week: a sudden jump or drop usually means the identifier or the timeout changed, not that visitors changed.
Engagement terms: what they did
- Engaged session. Per GA4: longer than 10 seconds, has a key event, or has at least two page or screen views. A site with a 9-second page that answers the question has no engaged sessions under this rule.
- Engagement rate = engaged sessions ÷ sessions. Sample: 6,200 ÷ 10,000 = 62%.
- Bounce rate = 1 − engagement rate (in the GA4 definition) = 38%. Under the single-page definition it would be single-page sessions ÷ sessions, a different number for the same visits.
- Pages per session = pageviews ÷ sessions. Sample: 31,000 ÷ 10,000 = 3.1.
- Average engagement time. Time the page was in focus, per active user; a visitor with the tab in the background is not being engaged.
- Scroll depth. The share of the page scrolled; useful only when you also record page length, because 75% of a short page is not 75% of a long one.
- Exit rate. The share of pageviews on a page that were the last of the session. A high exit rate on a thank-you page is good; on a pricing page it is a flag. It is not the same as a bounce.
Conversion terms: what they achieved
- Goal or key event. The event or page you decided counts as success: a signup, a purchase, a demo request.
- Conversion rate. Two versions exist, and they give different numbers for the same traffic. By sessions: 250 conversions ÷ 10,000 sessions = 2.5%. By users: 220 converting users ÷ 7,400 users = 2.97% (some people converted more than once, so conversions exceed converting users). Name the base each time you quote a rate. See conversion rate.
- Funnel. An ordered set of steps with the share of people who reach each. See funnel.
- Drop-off. The share lost between two steps: if 1,000 people reach step 2 and 700 reach step 3, drop-off is 300 ÷ 1,000 = 30%.
- Cohort. A group defined by when they first arrived or did something, followed over time. See cohort.
- Attribution. The rule that assigns credit for a conversion to the touches before it (first, last, linear). The rule is a convention. See attribution.
- Cost per acquisition (CPA) = spend ÷ conversions. With $2,000 of spend and 250 conversions, $8.00.
Performance and quality terms: how the site behaved
Google's web.dev defines three Core Web Vitals with these thresholds for a good experience, assessed at the 75th percentile of page loads, separately for mobile and desktop:
| Metric | What it measures | Good |
|---|---|---|
| LCP (Largest Contentful Paint) | When the main content is drawn | 2.5 seconds or less |
| INP (Interaction to Next Paint) | How fast the page responds to clicks and taps | 200 milliseconds or less |
| CLS (Cumulative Layout Shift) | How much content jumps while loading | 0.1 or less |
A page passes only if all three meet their targets at that percentile. "75th percentile" means that three out of four page loads were at least this good; an average would hide the slow quarter.
- Error rate = errors ÷ pageviews. Sample: 93 errors ÷ 31,000 pageviews = 0.30%.
- Affected sessions. How many sessions saw at least one error; one broken script on every page produces a large error count but may touch few sessions, and the reverse.
Data terms: what the numbers are made of
- Dimension and metric. A dimension is a label you group by (country, channel, page); a metric is a number you add up or average (sessions, conversions). A report is a metric broken down by a dimension.
- Segment. A subset of visitors or sessions defined by a rule, such as "visited pricing and came from email". See segment.
- Sampling. Calculating a report from a subset of data to save time. A sampled report can differ from an unsampled one; check whether your tool says it is sampling.
- Retention period. How long detailed records are kept. After it, only aggregated numbers remain.
- Consent. Whether the visitor allowed analytics collection; in some regions, no consent means less or no collection, which lowers counts without anything being broken.
- Data discrepancy. Two tools disagreeing on the same metric, usually because of different definitions, bot handling or consent rules. See data discrepancies.
Worked example: one week of terms
Sample data: one site, one week.
- 10,000 sessions, 7,400 users, 31,000 pageviews.
- Sessions per user: 10,000 ÷ 7,400 = 1.35. Pages per session: 31,000 ÷ 10,000 = 3.1.
- Engaged sessions: 6,200, so engagement rate 62% and bounce rate 38%.
- Conversions: 250 from 220 users. Conversion rate by sessions 2.5%; by users 2.97%.
- Errors: 93, so error rate 0.30%.
- Spend $2,000, so cost per acquisition $8.00.
Lay it out as in the table; every number comes with its formula so the next person can check it.
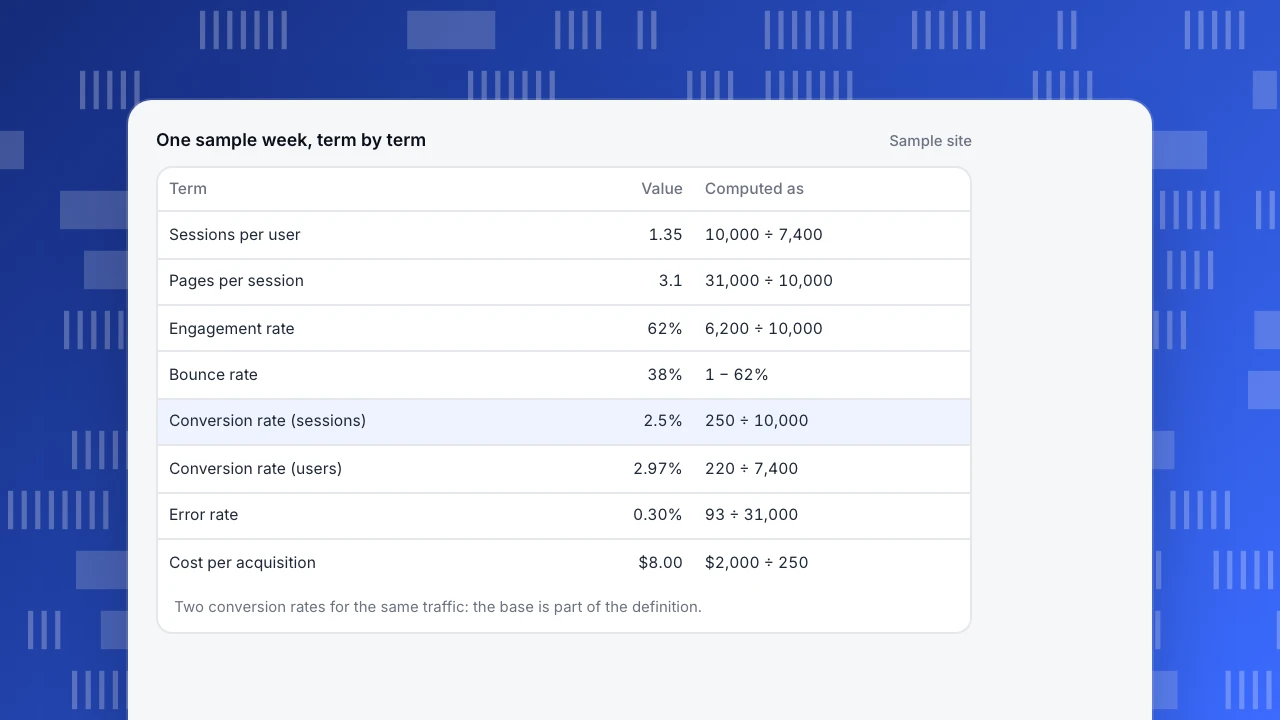
One sample week, term by term
Sample site| Term | Value | Computed as |
|---|---|---|
| Sessions per user | 1.35 | 10,000 ÷ 7,400 |
| Pages per session | 3.1 | 31,000 ÷ 10,000 |
| Engagement rate | 62% | 6,200 ÷ 10,000 |
| Bounce rate | 38% | 1 − 62% |
| Conversion rate (sessions) | 2.5% | 250 ÷ 10,000 |
| Conversion rate (users) | 2.97% | 220 ÷ 7,400 |
| Error rate | 0.30% | 93 ÷ 31,000 |
| Cost per acquisition | $8.00 | $2,000 ÷ 250 |
Two conversion rates for the same traffic: the base is part of the definition.
Terms that sound alike: how to tell them apart
| Pair | Difference | Example |
|---|---|---|
| Users vs sessions | People vs visits | 7,400 users made 10,000 sessions |
| Pageviews vs events | A page load vs any recorded action | Clicking a download is an event, not a pageview |
| Bounce vs exit | Left without engaging vs left from this page | An exit on the thank-you page is normal |
| Conversion rate by session vs by user | Different denominators | 2.5% vs 2.97% |
| Referrer vs source | Raw header vs the named origin | A tagged email link has a source even with no referrer |
| Visits vs visitors | Sessions vs people | Older tools use "visits" for sessions |
| Group | Terms | Question it answers |
|---|---|---|
| Traffic | User, session, pageview, source, UTM, direct, bot traffic | Who arrived and from where? |
| Engagement | Engaged session, engagement rate, bounce rate, pages per session | What did they do? |
| Conversion | Goal, conversion rate, funnel, drop-off, attribution, CPA | What did they achieve? |
| Performance | LCP, INP, CLS, error rate | How did the site behave? |
| Data | Dimension, metric, segment, sampling, consent | What are the numbers made of? |
Pick one definition per term and write it beside the report.
How to pin down definitions in your own reporting
- Write each metric as name, formula, base and window. "Conversion rate = conversions ÷ sessions, weekly."
- Note the tool's own definition of engaged session, session timeout and bot handling next to the report.
- Do not compare across tools without a conversion table of definitions; first align them, then compare. See web analytics best practices.
- Mark changes. If a definition or a tag changes, annotate the date.
- Keep the glossary in one place that the whole team uses.
Finding these terms in TapCub
Take the sample week. You want each term from this guide in one console, and bot traffic kept out of the base.
- Traffic. Web analytics › Overview gives the headline numbers, Web analytics › Sources the channel, source and UTM breakdown, Web analytics › Pages the pageviews by page, and Web analytics › Sessions the individual visits.
- Audience. Web analytics › Audience covers who the visitors are.
- Conversions. Define the goal in Web analytics › Goals (an event or a page counts as a conversion); the same data appears under All-platform analytics › Business › Goals.
- Bots. Web analytics › Bots lists crawlers and AI agents separately; recognised bots do not enter visitor counts or conversion rates, so the base for each rate above is people.
- Performance and errors. Monitoring › Performance shows real-user Core Web Vitals, and Monitoring › Errors shows error count, error rate (errors ÷ pageviews), affected visitors and affected sessions.
- Check definitions in the docs before comparing a TapCub number with another tool's; this article's rule applies there too.
FAQ
What are the most important web analytics terms?
Visitors or users, sessions, pageviews, source and medium, engagement rate, conversion rate and goals, funnel, and the three Core Web Vitals. They cover who arrived, what they did, what they achieved and how the site performed.
What is the difference between a user and a session?
A user is a person, identified by a browser, device or login; a session is one visit by that person, ending after a period of inactivity (30 minutes by default in GA4). In the sample, 7,400 users made 10,000 sessions.
What is bounce rate?
In GA4, bounce rate is the percentage of sessions that were not engaged, where an engaged session lasts longer than 10 seconds, has a key event or has two or more page views. Older tools define a bounce as a single-page visit, so the two numbers are not comparable.
How is conversion rate calculated?
Conversions divided by a base you name, usually sessions or users. In the sample, 250 ÷ 10,000 sessions = 2.5%, and 220 ÷ 7,400 users = 2.97%. Always write which base you used.
What are Core Web Vitals?
Three page-experience metrics defined by Google's web.dev: LCP (loading, 2.5 seconds or less), INP (responsiveness, 200 milliseconds or less) and CLS (visual stability, 0.1 or less), assessed at the 75th percentile of page loads.
Sources
- Google Analytics Help. [[GA4] Engagement rate and bounce rate](https://support.google.com/analytics/answer/12195621). Engaged session, engagement rate and bounce rate definitions. Checked 2026-11-21.
- Google Analytics Help. [[GA4] Session](https://support.google.com/analytics/answer/9191807). Session definition and 30-minute default timeout. Checked 2026-11-21.
- web.dev. Web Vitals. LCP 2.5 s, INP 200 ms, CLS 0.1 at the 75th percentile. Checked 2026-11-21.
Was this article helpful?
We use your answers to fix and expand this page.
Couldn’t send. Please try again in a minute.
Thanks for the feedback. We’ll use it to improve this page.You’ve already sent feedback on this page. Thanks.

Data Engineer
Writes about event design, data quality, and collection workflows, with verifiable implementation methods for reliable analytics.