Try it on your own data
Every report in this article is in the free plan. One snippet for web and apps, up to 10 sites.
Start freeWebsite funnel analysis counts how many people reach each step of a path such as visit, pricing, signup and activation, and where they stop. Each step rate is people at the step divided by people at the previous step. In the sample, the biggest loss is not the best fix: 5 more points at signup start is worth +60 people, at signup finish only +24.
What you will learn
- Step rate = people at this step ÷ people at the previous step; overall rate is the product of all step rates
- Rank fixes by people gained from a realistic gain, not by raw drop-off
- Split by device or source: a blended 75% hid 90% on desktop and 60% on mobile
What website funnel analysis measures
A website funnel is an ordered list of steps a visitor takes toward one outcome, such as signing up. Funnel analysis counts how many people reach each step, what share continues to the next one, and where the biggest losses are. It answers "where do people stop?" so you know which page or form to look at before you change anything. If you are still choosing a tool, see funnel analytics tools; common mistakes in reading results are in funnel analysis mistakes.
How to choose the steps
Pick steps that are real, ordered and countable:
- One outcome per funnel. "Visit → pricing → start signup → finish signup → first project created" is one funnel. Adding "read blog" makes it two journeys.
- Each step is one page path or one event. If you cannot name the event, you cannot count it.
- Between 3 and 7 steps. Fewer hides the leak; more splits the sample so thin that rates bounce around. Google Analytics 4 allows up to 10 steps in a funnel exploration; TapCub allows up to 20. Allowing more does not mean you should use them.
- Include the step where you ask for something, such as the email field or the payment form. That is usually where the largest drop sits.
- Decide the unit before you start: people or sessions, and how long a person has to finish.
Open or closed, and direct or indirect
Two settings change the numbers more than any design change you make. Google's documentation defines them clearly. An open funnel lets people enter at any step; a closed funnel counts only people who enter at the first step. A step can be directly followed (immediately after the previous one) or indirectly followed (other actions may sit in between).
| Setting | Counts | Use it when |
|---|---|---|
| Closed funnel | Only people who started at step 1 | You want a true start-to-finish conversion rate |
| Open funnel | People entering at any step | Some people reach step 3 by a bookmark or email link |
| Indirectly followed | Other pages allowed in between | Normal browsing, which is almost always the case |
| Directly followed | Nothing in between | A checkout where any detour is itself a signal |
If two tools disagree on the same funnel, check these two settings and the time window first.
Calculate conversion and drop-off, step by step
Sample data: one month of a SaaS site, counted by unique people.
| Step | People | Rate from previous step | Rate from step 1 | Lost at this step |
|---|---|---|---|---|
| 1. Visited the site | 10,000 | n/a | 100% | n/a |
| 2. Viewed pricing | 3,200 | 32.0% | 32.0% | 6,800 |
| 3. Started signup | 960 | 30.0% | 9.6% | 2,240 |
| 4. Finished signup | 720 | 75.0% | 7.2% | 240 |
| 5. Created first project | 360 | 50.0% | 3.6% | 360 |
The two formulas are:
- Step rate = people at this step ÷ people at the previous step. Pricing: 3,200 ÷ 10,000 = 32.0%.
- Drop-off = 1 − step rate, or in people, previous step minus this step. Signup start to finish: 960 − 720 = 240 people, a 25.0% drop.
The overall rate is 360 ÷ 10,000 = 3.6%. It also equals the product of the four step rates: 0.32 × 0.30 × 0.75 × 0.50 = 0.036.
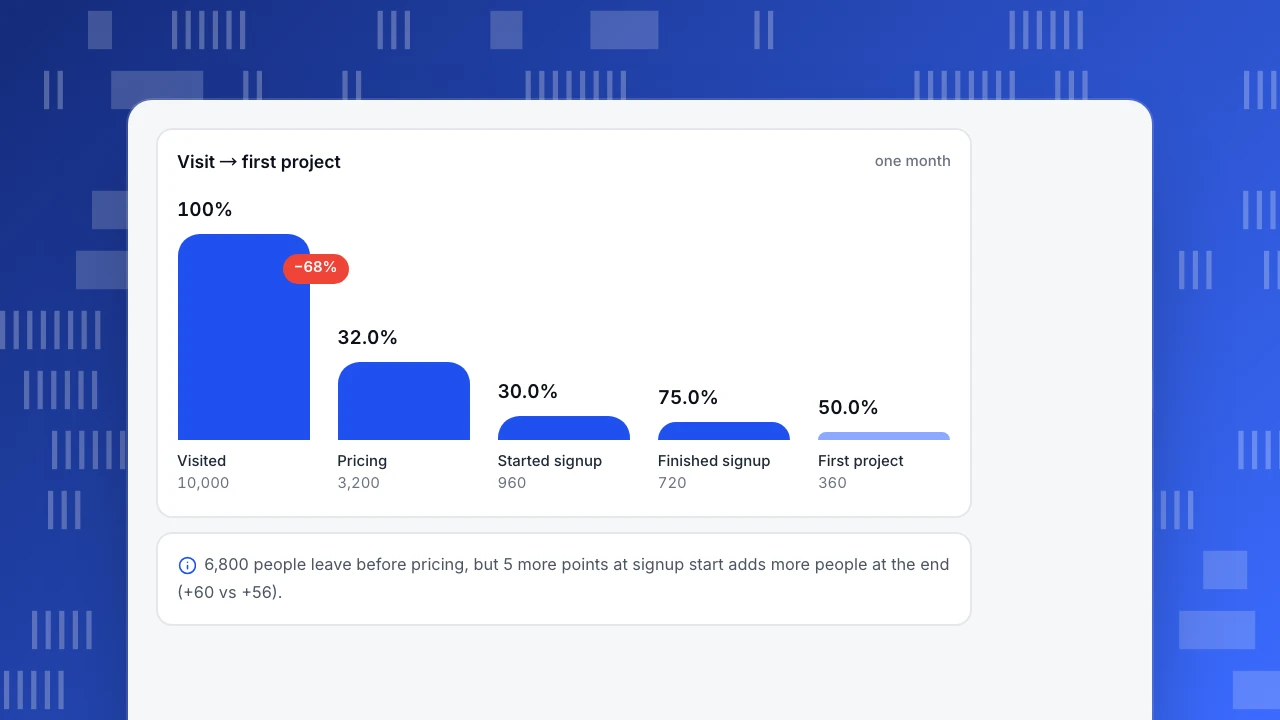
Visit → first project
one monthVisited
10,000
Pricing
3,200
Started signup
960
Finished signup
720
First project
360
Which step to fix first
The largest absolute loss, 6,800 people between the visit and pricing, is not necessarily the best lever. Ask a different question: if one step's rate improved by 5 percentage points, how many more people reach the end?
| Step improved by 5 points | New rate | People at the end | Gain |
|---|---|---|---|
| Visit → pricing (32% → 37%) | 37% | 416.25 | +56 |
| Pricing → start signup (30% → 35%) | 35% | 420 | +60 |
| Start → finish signup (75% → 80%) | 80% | 384 | +24 |
| Finish signup → first project (50% → 55%) | 55% | 396 | +36 |
The same 5 points are worth +60 at the signup-start step and +24 at the signup-finish step, because there are more people upstream. A relative 10% improvement at any step gives +10% at the end (+36 people); the differences come from how many percentage points each fix is likely to move. Use two rules: fix the step with the lowest rate where you have a clear cause, and prefer steps where a 5-point move looks realistic.
Turn the priority into a plan by writing three lines per candidate fix: the step it targets, the gain you think is realistic (for example +5 points at signup start), and the number you will check afterwards. If signup start moves from 30% to 35% on 3,200 pricing viewers, you expect 1,120 starts instead of 960, which is 160 more. If the next month shows 1,000 starts, the fix did something, but less than hoped, and the margin of about ±1.6 points on 3,200 people tells you that 1,000 is not yet proof.
| Step | People | Rate from previous step | Lost |
|---|---|---|---|
| Visited | 10,000 | n/a | n/a |
| Pricing | 3,200 | 32.0% | 6,800 |
| Started signup | 960 | 30.0% | 2,240 |
| Finished signup | 720 | 75.0% | 240 |
| First project | 360 | 50.0% | 360 |
Sample data: one month, unique people. Overall rate 360 ÷ 10,000 = 3.6%.
Segment the funnel, or the average will hide the problem
The same data split by device:
| Segment | Visits | Pricing | Start signup | Finish signup | First project |
|---|---|---|---|---|---|
| Desktop | 4,000 | 1,600 (40.0%) | 480 (30.0%) | 432 (90.0%) | 216 (50.0%) |
| Mobile | 6,000 | 1,600 (26.7%) | 480 (30.0%) | 288 (60.0%) | 144 (50.0%) |
| Total | 10,000 | 3,200 | 960 | 720 | 360 |
The blended finish-signup rate of 75% hides a gap: 90% on desktop and 60% on mobile. Fixing the mobile form is worth about 480 × (0.90 − 0.60) = 144 more finished signups, which carry through to the next step at 50%. Split by device, source, new or returning, and country, in that order, and stop when you find a segment whose rate is 15 points or more below the rest.
How many people do you need before you trust a rate?
A step rate from few people moves a lot by chance. A rough 95% margin for a proportion p from n people is 1.96 × √(p × (1 − p) ÷ n); the formula is in NIST's Engineering Statistics Handbook. For the sample:
- Pricing → start (p = 0.30, n = 3,200): ±1.6 points
- Start → finish (p = 0.75, n = 960): ±2.7 points
- Finish → first project (p = 0.50, n = 720): ±3.7 points
So a change of 1 point in the last step is noise, while a drop of 5 points is not. Wait until the step has about a thousand people before acting, or use a longer date range. The margin also grows with segments: the mobile row of the finish-signup step (n = 480) has a margin of ±4.4 points.
Set the conversion window before you compare funnels
The window is how long a person has to get from step 1 to the last step. It changes the answer even when behaviour does not. Sample data: of the 960 people who started signup, 468 finished within 1 day, 612 within 7 days and 720 within 30 days.
| Window | Finished signup | Start → finish rate |
|---|---|---|
| 1 day | 468 | 48.8% |
| 7 days | 612 | 63.8% |
| 30 days | 720 | 75.0% |
A team comparing a 1-day window this month with a 30-day window last month would think signup got 26 points worse. Pick the window from the median time to finish (people mostly finish within that long), keep it fixed for every report, and do not read the most recent days of a long window until the window has fully elapsed: people who started yesterday have not had 30 days yet.
Check the funnel before you trust it
- The final step should match another source. If your signup events say 720 and your database says 810, find the gap before reading the rates.
- Test the order. Click through the funnel once yourself and confirm every step appears in the live data.
- Check the window. A person who views pricing on day 1 and signs up on day 9 is a conversion only if the window is at least 9 days.
- Remove non-human traffic. Bots inflate the first step and depress every rate after it.
- Compare like periods. Use the same weekdays; a Monday-to-Sunday week against a partial week misleads.
How to do it in TapCub
Build the SaaS funnel above in TapCub:
- Open the builder. Go to All-platform analytics › Behavior › Behavior analysis; it opens on Funnels.
- Add steps. Each step is event names or page paths (several names are OR, paths can use a wildcard), with its own filters. Set the window (default 7 days, up to 180) and the order: ordered, strict or any order.
- Read the table. Each step shows count, rate versus step one, rate versus the previous step, drop-off and median time from the previous step; the largest drop is marked. Click a step to see who arrived or who dropped there.
- Break it down. Use breakdown for device, source or country; it keeps the 10 groups with the most entries. Counting defaults to unique people (first entry per person per session).
- Keep bots out. Recognised bots are counted separately, so they do not inflate the first step.
TapCub measures where people stop; it does not run A/B tests, so test changes with your own experiment tool and read the result in the funnel.
FAQ
What is website funnel analysis?
It counts how many visitors reach each step of an ordered path, such as visit, pricing, signup and activation, and what share continues. The drop-off between steps shows where visitors stop, so you know what to investigate first.
How do you calculate funnel drop-off?
Divide the people at a step by the people at the previous step to get the step rate, then subtract from 1. In the sample, 720 of 960 people finish signup: 75.0% continue and 25.0% drop off.
What is a good funnel conversion rate?
There is no single good number. Compare each step with your own earlier periods and across segments. In the sample, a 60% finish-signup rate on mobile against 90% on desktop is the useful finding, not the 75% average.
What is the difference between open and closed funnels?
An open funnel counts people who enter at any step; a closed funnel counts only people who start at step one. Use closed for a true start-to-finish rate.
How many steps should a funnel have?
Between three and seven. Fewer hides the leak; more splits the sample so thin that rates are unreliable.
Sources
- Google Analytics Help, Funnel exploration (open and closed funnels, up to 10 steps, directly or indirectly followed).
- NIST/SEMATECH e-Handbook of Statistical Methods, 7.2.4.1 Confidence intervals for a proportion.
- TapCub documentation, Funnels (docs.tapcub.com), checked 2026-11-21.
Was this article helpful?
We use your answers to fix and expand this page.
Couldn’t send. Please try again in a minute.
Thanks for the feedback. We’ll use it to improve this page.You’ve already sent feedback on this page. Thanks.

Customer Experience Consultant
Writes about live chat, visitor conversations, and self-service, sharing practical ways to make customer communication clearer and more effective.