Try it on your own data
Every report in this article is in the free plan. One snippet for web and apps, up to 10 sites.
Start freeMatch the chart to the question: a line chart for direction over time, bars for totals you compare, sorted horizontal bars for ranking sources and stacked areas only for a few layers. In our 28-day sample, a bar axis starting at 7,000 makes a 1.23 times gap look like 11 times, and one campaign day makes week 3 look 19.5% higher when the real gain is 3.0%.
What you will learn
- Pick the chart from the question: line for trend, bars for totals starting at zero, sorted horizontal bars for ranking
- Draw a 7-day average over daily data; a Saturday looks 41% down on Friday every week
- Write the caption first: what changed, by how much, over what period, and what explains it
Choose the chart from the question
A website traffic graph is only as good as the question it answers. The same numbers can produce a line, a bar chart or an area chart, and each one makes a different question easy and another one hard. Decide the question first, then pick the chart.
| Your question | Chart that answers it | Why | Watch out for |
|---|---|---|---|
| Is traffic going up or down over time? | Line chart | Position along a time axis shows direction and rhythm | Weekly cycles hide the trend in daily data |
| How does this week compare with last week? | Bar chart of period totals | Bar length is easy to compare | A bar axis that does not start at zero |
| Which source or page brings the most? | Horizontal bar chart, sorted | Long labels fit and ranking is obvious | More than about 10 bars |
| What is each channel's share of traffic? | 100% stacked bar or a table | Shares add to a whole | Stacked areas hide the middle series |
| Did something happen on a particular day? | Line chart with a marker | A marker ties the bump to a cause | Spikes that stretch the axis |
| How do two measures move together? | Two charts, one above the other | Same time axis, separate scales | Dual axes that invent a correlation |
For the dual-axis case, see dual axis chart. For how to read the numbers themselves, see website traffic analysis.
| Your question | Chart | Watch out for |
|---|---|---|
| Is traffic going up or down over time? | Line chart | Weekly cycles hide the trend in daily data |
| How does this week compare with last week? | Bar chart of period totals | An axis that does not start at zero |
| Which source or page brings the most? | Horizontal bar chart, sorted | More than about 10 bars |
| What is each channel's share? | 100% stacked bar or table | Stacked areas hide the middle series |
| Did something happen on one day? | Line chart with a marker | A spike that stretches the axis |
| How do two measures move together? | Two charts, one above the other | Dual axes that invent a correlation |
Pick the chart from the question, not the other way around.
The one dataset behind every chart below
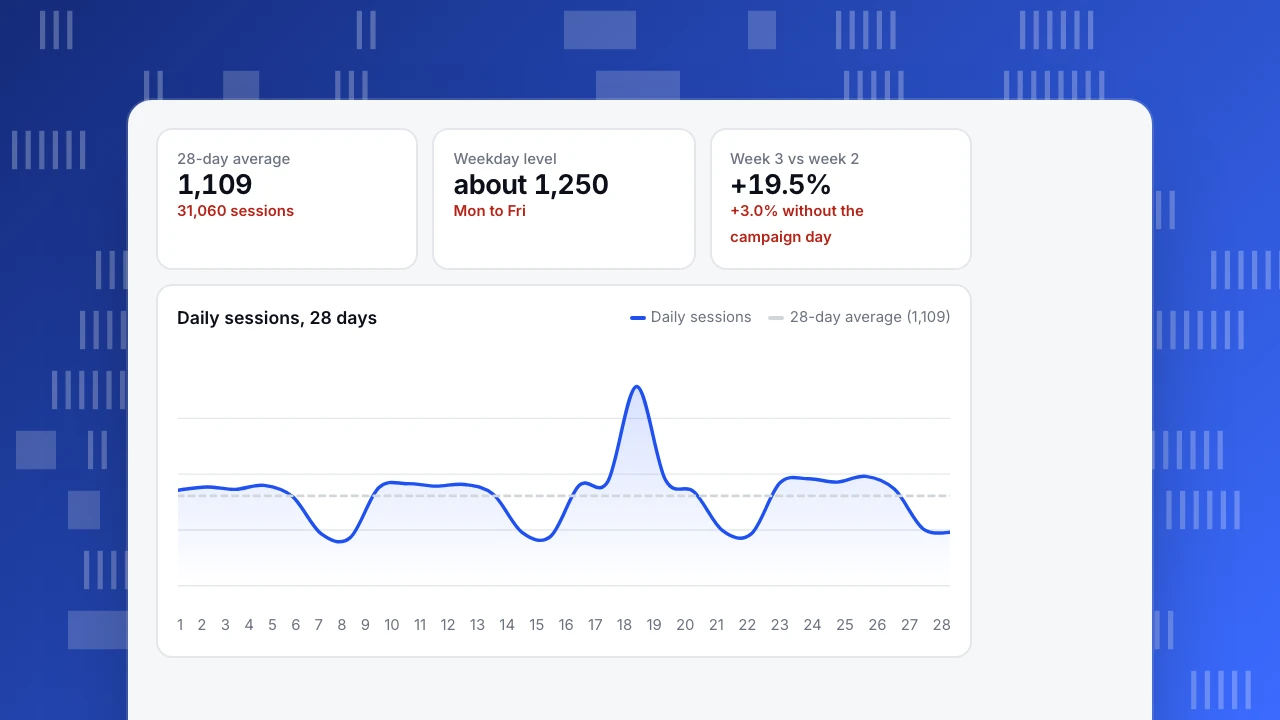
Sample data: 28 days of daily sessions for a site, Monday to Sunday, four weeks. The Wednesday of week 3 had a one-day campaign.
| Week | Mon | Tue | Wed | Thu | Fri | Sat | Sun | Total | Daily average |
|---|---|---|---|---|---|---|---|---|---|
| 1 | 1,180 | 1,220 | 1,190 | 1,240 | 1,100 | 640 | 590 | 7,160 | 1,023 |
| 2 | 1,210 | 1,260 | 1,230 | 1,250 | 1,130 | 660 | 610 | 7,350 | 1,050 |
| 3 | 1,240 | 1,290 | 2,460 | 1,310 | 1,160 | 680 | 640 | 8,780 | 1,254 |
| 4 | 1,270 | 1,320 | 1,280 | 1,350 | 1,190 | 700 | 660 | 7,770 | 1,110 |
The 28 days add up to 31,060 sessions, an average of 1,109 a day. Weekdays run near 1,250 and weekends near 650. Keep these two facts in mind: the site has a weekly rhythm, and one day is an outlier.
Line chart: for direction and rhythm
A line chart puts time on the horizontal axis and joins the points, so the eye reads direction and shape. It is the right chart for "is traffic rising?"
Drawn daily, this dataset shows a saw-tooth: five high days, two low days, repeat. That is real, and it is also why a daily line is bad at answering "is it rising?" The Saturday after a Friday looks like a 41% drop (700 against 1,190), and it happens every week. Two fixes:
- Draw a 7-day average instead of, or on top of, the daily line. The seven-day average at the end of each week is 1,023, 1,050, 1,254 and 1,110, which shows the week-3 bump and a return to a gently rising baseline.
- Compare like days: Monday with Monday, weekend with weekend.
A 7-day average is the sum of the last seven days divided by seven. On the Sunday that ends week 2 it is 7,350 ÷ 7 = 1,050; on the Sunday that ends week 3 it is 8,780 ÷ 7 = 1,254. A moving average also carries the one-day campaign for exactly seven days, until that Wednesday drops out of the window, so the echo you see in the line lasts a week even though the event lasted a day.
Use a line only when the points are in order and evenly spaced. If days are missing, do not let the line connect across the gap as if nothing happened; show the gap.
28-day average
1,109
31,060 sessions
Weekday level
about 1,250
Mon to Fri
Week 3 vs week 2
+19.5%
+3.0% without the campaign day
Daily sessions, 28 days
Daily sessions28-day average (1,109)Bar chart: for comparing totals
Bars compare amounts, so use them for week totals, monthly totals and anything that is a number of things. The week totals here are 7,160, 7,350, 8,780 and 7,770.
The bar chart has one strict rule: start the axis at zero, because bar length is the message. The rule matters because the eye compares areas and lengths, not numbers. If the axis starts at 7,000, the bars have heights of 160, 350, 1,780 and 770, and week 3 looks 11 times as tall as week 1. The real ratio is 8,780 ÷ 7,160 = 1.23.
The campaign day is also why week 3 looks like a 19.5% gain over week 2 (8,780 ÷ 7,350 − 1). Replace that Wednesday with a typical 1,250 and the gain is 3.0%. A bar chart shows the first number; a line chart of the same data shows that the whole gain is one day. Pair them when you report.
Area chart and stacked area: for parts of a whole, with care
An area chart fills the space below a line. A single filled line adds little to a line chart. Its use is the stacked area, which shows how channels add up to the total over time.
Sample data, week 4 (7,770 sessions) by channel:
| Channel | Sessions | Share |
|---|---|---|
| Organic search | 3,500 | 45.0% |
| Direct | 1,900 | 24.5% |
| Paid | 1,500 | 19.3% |
| Referral | 870 | 11.2% |
Stacked areas have a weakness: only the bottom layer sits on a common baseline. A reader can judge the total and the bottom layer, but the paid layer's thickness, sitting on top of two others, is hard to read as it wobbles. The rules:
- Put the series you care most about at the bottom.
- Use four or fewer layers.
- If shares matter more than volume, use a 100% stacked chart or the share table above.
- If you need to compare layers over time, use small multiples: one small line chart per channel with the same axis.
Ranking sources and pages: horizontal bars, sorted
For "which source brings the most?", sort the bars by value and draw them horizontally. William Cleveland and Robert McGill's 1984 study of graphical perception ranked how accurately people read different visual encodings: position along a common scale came first, then position on non-aligned scales, then length, then angle, then area. Bars use position or length on a common baseline; pie slices rely on angle and area, which are read less accurately. This is the reason to rank with bars, and to keep a pie chart, if you use one at all, to two or three slices.
Keep to 10 bars. Group the long tail into "other" so the chart does not become a list.
Pitfalls that make traffic graphs lie
- A truncated bar axis. Shown above: 1.23 times looks like 11 times.
- A partial last period. If you draw the current week and it is only Wednesday, the bar falls. Mark it or leave it out.
- Dual axes. Two lines on two scales can be made to cross anywhere. Use two stacked charts.
- Too many lines. More than five series is a tangle; label the lines directly or split them.
- Color alone to tell series apart. The Web Content Accessibility Guidelines (WCAG 2.2, success criterion 1.4.11) ask for at least 3:1 contrast for lines and bars you need to read, and recommend labels so the chart does not rely on hue alone. Label the lines or use different line styles.
- Smoothing that hides spikes. A smoothed line rounds off the campaign day; show the raw points as well.
- Counting bots as readers. A spike made by crawlers is not growth, and it will distort any chart.
Write the caption before you share the graph
A graph without a sentence invites the wrong reading. Use this template: what changed, by how much, over what period, and the one thing that explains it.
For the sample data, three honest captions are:
- "Daily sessions averaged 1,109 over 28 days, with weekdays near 1,250 and weekends near 650."
- "Week 3 was 19.5% above week 2 because of a one-day campaign on Wednesday; without it the gain is 3.0%."
- "Week 4 returned to a daily average of 1,110, 8.5% above week 1 (1,023)."
The last number checks out: 1,110 ÷ 1,023 = 1.085. If you cannot write the sentence, the chart is not ready, or it is the wrong chart for the question.
Reading these graphs in TapCub
Pick the question first, then use the matching report.
- For direction over time, open Web analytics › Overview and read the trend. Use the date-range comparison for like-for-like periods, such as this Monday-to-Sunday against last, so the weekly cycle cancels out.
- For the campaign day in the sample, add a marker in Configuration › Annotations, so the bump carries a label the next time anyone opens the chart.
- For "which source brings the most?", open Web analytics › Sources and sort by sessions; for the shares in the channel table, read the same report.
- For an unexplained spike, check Web analytics › Bots. Recognised bots and AI crawlers are counted apart, so they are not in the visitor trend; a bump that disappears there was automated traffic.
- To watch a metric without opening the chart, set a monitor in All-platform analytics › Operations › Monitors; it checks by the hour, day, week or month and can alert you, for example if daily sessions fall below a number you set.
FAQ
What is the best graph for website traffic over time?
A line chart, with a 7-day average drawn over or beside the daily line. It shows direction and rhythm. Use bars only for period totals.
Should I use a line chart or a bar chart for traffic?
Use a line for a series in time order and bars for totals you compare. If you compare weeks, bars of weekly totals starting at zero are right; if you look for a trend, use a line.
Are pie charts bad for traffic sources?
They are fine for two or three slices. Beyond that, people read angle and area less accurately than length, so a sorted horizontal bar chart shows the ranking more clearly.
Why does my daily traffic graph look jagged?
Most sites have a weekly cycle, such as lower weekend traffic. Draw a 7-day average or compare the same weekday week to week.
How many lines can one graph have?
Up to about five, with direct labels. Beyond that, split into small charts with the same axis.
Sources
- Cleveland, W. S., and McGill, R. (1984). Graphical Perception: Theory, Experimentation, and Application to the Development of Graphical Methods. Journal of the American Statistical Association, 79(387), 531–554.
- W3C. Understanding Success Criterion 1.4.11: Non-text Contrast: graphical objects needed to read a chart require 3:1 contrast. Checked 2026-11-21.
Was this article helpful?
We use your answers to fix and expand this page.
Couldn’t send. Please try again in a minute.
Thanks for the feedback. We’ll use it to improve this page.You’ve already sent feedback on this page. Thanks.

Product Experience Specialist
Writes about product experience, practical workflows, and growth, turning complex processes into clear steps for everyday decisions.