Try it on your own data
Every report in this article is in the free plan. One snippet for web and apps, up to 10 sites.
Start freeTo read website traffic over time, split the line into trend, season and spike. Use weekly buckets, smooth with a rolling median so one spike cannot fake a trend, and compare with the same weeks last year, not only the previous month. A rise is a trend only if it survives all three checks.
What you will learn
- One 7,900-session week lifts a 4-week average by about 1,000 for four weeks; a rolling median barely moves
- Month-on-month said +8.7%; year-on-year showed growth slowing from +31.4% to +14.3%
- Seasonal effects can be a few percentage points even in national retail data, so compare like with like
What is in a traffic line: trend, season and spike
A line of sessions per day mixes three different things:
- Trend: the slow, lasting direction, such as growing 2% a month because search rankings improved.
- Season: a pattern that repeats on a calendar, such as weekends, month-ends, holidays or back-to-school.
- Spike: a one-off burst or dip caused by one post going viral, a campaign day, an outage or a tracking change.
Each needs a different response. A trend is a result you can credit to something and keep doing. A season is a pattern to plan around, not a result. A spike is an event to annotate and explain. The most common mistake is to treat a spike as a trend, or a season as a result.
Statisticians use smoothing for this job. The NIST e-Handbook of Statistical Methods describes smoothing as a way to remove random variation so that, when properly applied, it reveals the underlying trend, seasonal and cyclic components. The rest of this article is a practical version of that idea for a website.
Choose weekly buckets and a window
Daily data has a built-in weekly season: a B2B site loses traffic on weekends, a consumer site often gains it. If you chart days, the zigzag hides everything else. Aggregating to weeks removes the weekday pattern in one step, because every bucket contains every weekday exactly once.
Then pick a window for smoothing:
| Window | Good for | Weakness |
|---|---|---|
| 4 weeks | Seeing a trend within a quarter | One spike distorts it for 4 weeks |
| 8 weeks | Slow trends on steady sites | Reacts late |
| 13 weeks | Quarter-over-quarter reading | Hides short changes |
Use 4 weeks for sites with more than a few thousand sessions a week, and 8 for smaller ones where weekly values are noisy.
Moving average or rolling median: one spike changes the answer
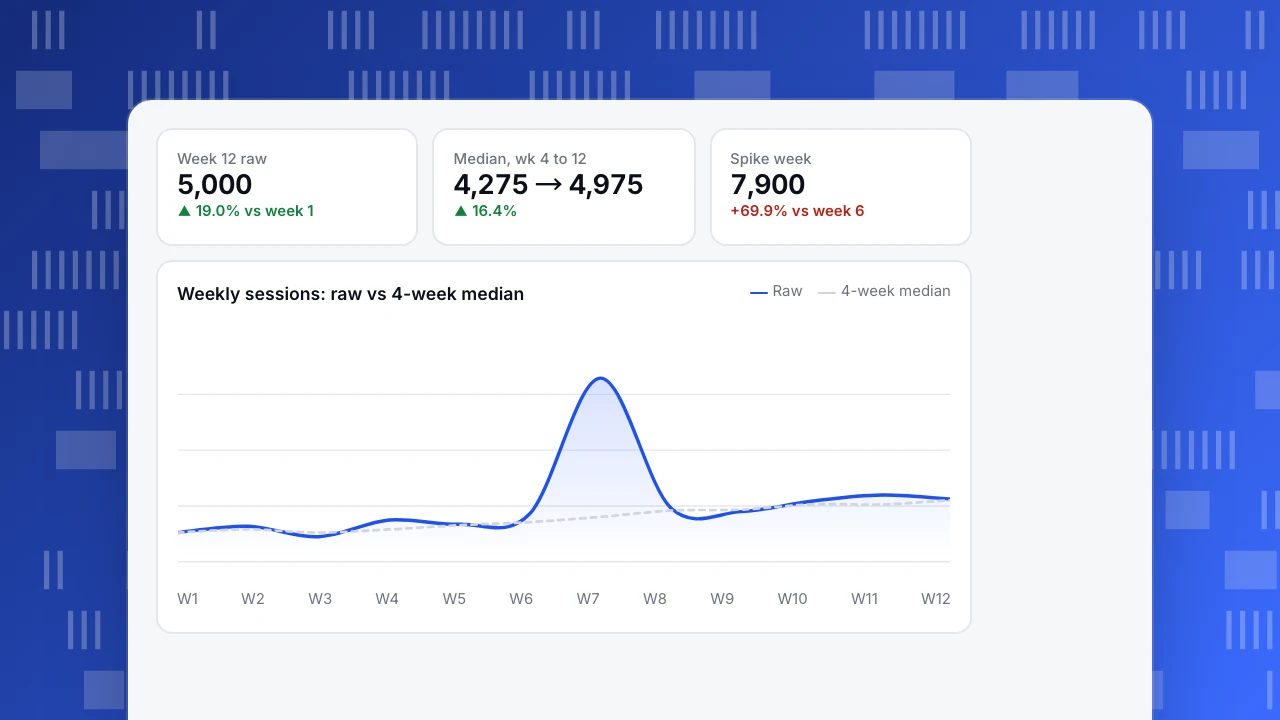
Sample data: 12 weeks of sessions, with week 7 containing a viral post.
| Week | 1 | 2 | 3 | 4 | 5 | 6 | 7 | 8 | 9 | 10 | 11 | 12 |
|---|---|---|---|---|---|---|---|---|---|---|---|---|
| Sessions | 4,200 | 4,350 | 4,100 | 4,500 | 4,400 | 4,650 | 7,900 | 4,800 | 4,700 | 4,950 | 5,100 | 5,000 |
| 4-wk average | 4,200 | 4,275 | 4,217 | 4,288 | 4,338 | 4,412 | 5,362 | 5,438 | 5,512 | 5,588 | 4,888 | 4,938 |
| 4-wk median | 4,200 | 4,275 | 4,200 | 4,275 | 4,375 | 4,450 | 4,575 | 4,725 | 4,750 | 4,875 | 4,875 | 4,975 |
(The first three weeks use the weeks available so far.)
Week 7 is 69.9% above week 6 (7,900 vs 4,650). The 4-week average rises to 5,362 in week 7 and stays above 5,400 until week 10, because the spike sits inside the window. When it drops out in week 11 the average falls from 5,588 to 4,888, a 12.5% "decline" that never happened. The 4-week median ignores the single extreme value: it climbs steadily from 4,275 in week 4 to 4,975 in week 12, which is +16.4%. That is the trend.
Rule: use the rolling median to read the trend and the average to count totals. Annotate the spike so nobody tries to explain it as a trend.
Week 12 raw
5,000
▲ 19.0% vs week 1
Median, wk 4 to 12
4,275 → 4,975
▲ 16.4%
Spike week
7,900
+69.9% vs week 6
Weekly sessions: raw vs 4-week median
Raw4-week medianMonth on month or year on year
If your traffic is seasonal, comparing a month with the previous month mixes trend and season. Sample data: October sessions were 18,400 and November 20,000, so month on month is +8.7%. That looks modest. Last year the same two months were 14,000 and 17,500, a +25.0% rise, so the autumn season alone accounts for a much bigger step.
Compare with the same month last year instead:
- October: 18,400 ÷ 14,000 − 1 = +31.4%
- November: 20,000 ÷ 17,500 − 1 = +14.3%
Year on year shows growth was strong in October and slowed sharply in November. Month on month would have said "up 8.7%, fine". The accurate story is "growth halved". Look for something that changed in November: a ranking loss, a paused campaign, or a tracking change.
Year on year needs at least a year of data and a similar calendar. Holidays that move (Easter, Lunar New Year, Black Friday week) can still distort one comparison, so check the week's dates.
| Month | Last year | This year | Month on month | Year on year |
|---|---|---|---|---|
| October | 14,000 | 18,400 | — | +31.4% |
| November | 17,500 | 20,000 | +8.7% (last year: +25.0%) | +14.3% |
Sample data: monthly sessions. The month-on-month rise is smaller than last year's seasonal rise; year-on-year shows the real change.
How big can seasonality be
Even large national series carry a seasonal effect. The U.S. Census Bureau publishes quarterly retail e-commerce sales both seasonally adjusted and not adjusted. For Q3 2026 it reports $347.3 billion (17.9% of total retail sales) adjusted and $335.7 billion (17.2%) not adjusted. The two differ by 3.5% in dollars (347.3 ÷ 335.7 − 1) and 0.7 points in share, in a quarter that is not a holiday quarter. A single website with its own calendar has a far larger seasonal swing, which is why you compare like with like instead of month with month.
Decision rules
- Never react to one week. A move counts as a candidate trend after the 4-week median has risen or fallen for at least 3 weeks in a row.
- Compare with the same period last year whenever you have a full year, and with last week's equivalent week otherwise.
- Annotate every launch, campaign, outage and tracking change the day it happens.
- Ask what the spike was before dropping it. If it came from a post you can repeat, it is a source, not noise.
- Check the mix. If traffic rose but one channel produced all of it, the trend is that channel's trend, not the site's.
- Exclude bots before judging. A crawler burst looks like a spike and inflates every average.
Common traps when reading a traffic chart
Five things make a line look like a trend when it is not.
| Trap | What it looks like | How to check |
|---|---|---|
| Partial period | The latest week or month looks like a collapse | Compare only complete periods, or scale by days |
| Tracking change | A step up or down on one date, across all pages | Check your annotations and release log for that date |
| Bots | Spikes with no source or a single country | Separate automated traffic before judging |
| Consent or blocker changes | A drop in recorded visits with no drop in orders | Compare orders or sign-ups, which do not depend on the tag |
| Definition change | A rate changes on the day a setting changed | Keep one definition of a visit and a bounce |
The first trap is the most common. Sample data: the previous full week had 4,700 sessions. Today is Friday evening and this week has 3,100 sessions so far, five days of seven. Compared directly, that is 3,100 ÷ 4,700 − 1 = −34.0%, which looks alarming. Scale to a full week first: 3,100 ÷ 5 × 7 = 4,340, and 4,340 ÷ 4,700 − 1 = −7.7%. That is a soft week, not a collapse; a Monday-Tuesday-heavy site would need a more careful weekday weighting.
The rule is simple: never put an incomplete period next to a complete one. Chart complete weeks, and label the current one as "so far".
A second check applies whenever a traffic chart falls: look at a number that does not rely on the tracking tag, such as orders in your store or sign-ups in your database. If visits fell 12% and orders did not move, suspect measurement before you suspect demand.
A ten-minute weekly review
A routine beats a heroic investigation after something breaks. Every Monday:
- Open the last 13 complete weeks of sessions, bucketed by week, with bots excluded.
- Add the 4-week rolling median and note its direction: up, flat or down, for how many weeks.
- Compare the latest complete week with the same week last year, if you have a year of data.
- Check the split by channel and device for the latest week. If one channel moved more than the others, note it.
- Read your annotations for the period. Every spike or step should have a note, or become a question for the team.
- Write one line: "Median up three weeks, +16%; year on year +14%; paid search drove the week."
The line is the useful output. After a quarter, the lines become a record of what moved traffic and what did not, which is exactly what you need when someone asks whether the new content programme worked.
Set an alert for the exceptional cases only: a week more than 40% below the 4-week median, or a bot burst. Everything else belongs in the Monday review, not in your inbox.
How to read traffic over time in TapCub
Start from the sample 12 weeks above.
- Open Web analytics › Reports (the data report). Choose columns such as visitors, sessions and pageviews and set the buckets to week. Each row is one week, so the weekday pattern is gone.
- Turn on Show change and compare with the previous period or the same period last week. For year on year, run the report for this year's weeks, then again for the same date range last year.
- Click the spike row to open Web analytics › Overview for those dates, then Web analytics › Sources to see which channel produced it.
- Add a note in Configuration › Annotations for the date of every release, campaign and outage, so the line explains itself later.
- Check Web analytics › Bots if a spike has no source. Bots are counted separately, so human visitors are not inflated; the report shows when automated requests jumped.
TapCub shows the line, the change and the sources. It does not smooth the line into a forecast, so keep the median arithmetic in a sheet next to the report.
FAQ
How do I track website traffic over time?
Chart sessions or visitors by week in your analytics tool, keep the same definition of a visit, and compare with the previous period and the same weeks last year. Annotate launches and campaigns so every bump has an explanation.
How do I tell a trend from a spike?
A spike is one or two weeks far from its neighbours; a trend persists. Use a 4-week rolling median and call it a trend only after it has moved in the same direction for three weeks.
Why does my traffic drop every year at the same time?
That is seasonality. Compare the drop with the same weeks in earlier years. If the drop is no bigger than before, nothing is wrong; if it is deeper, look at channels and pages.
Should I use daily, weekly or monthly traffic data?
Use days to investigate an event, weeks to read the trend and months to report and plan. Weeks remove the weekday pattern; months are too coarse to see a change inside a quarter.
What is a good year-on-year growth rate?
It depends on your starting size and market. Compare the rate with your own previous year and with your plan. A falling year-on-year rate, like +31.4% to +14.3% in the example, is a signal worth investigating even when the number is positive.
Sources
Was this article helpful?
We use your answers to fix and expand this page.
Couldn’t send. Please try again in a minute.
Thanks for the feedback. We’ll use it to improve this page.You’ve already sent feedback on this page. Thanks.

Data Analyst
Explores traffic sources, conversion funnels, and retention, using clear metric definitions and concrete examples to explain what the numbers mean.