Try it on your own data
Every report in this article is in the free plan. One snippet for web and apps, up to 10 sites.
Start freeGood onboarding examples share one trait: they get a new user to a first valuable action in fewer steps. This guide gives six patterns (one first action, a checklist with a head start, a goal question, sample data, deferred sign-up and a nudge), the activation metric each targets and how each fails, then works a before-and-after funnel where activation rose from 24.0% to 33.0%.
What you will learn
- Judge an example by the activation metric it moves, not by how polished it looks
- Fewer, more specific steps beat a longer tour: at 70% per step, five steps keep 16.8% and four keep 24.0%
- Check that activation predicts day-30 retention before you celebrate it
What makes an onboarding example worth copying?
An onboarding flow is worth copying only if it raises activation: the share of new users who reach the first moment of real value. A flow can look polished and still lose people, and a plain one can work. So every example below is described by three things: what the user sees, the activation metric it targets, and how it usually fails.
Before copying anything, write down your own activation event. It should be one observable action that new users who stay have done and new users who leave have not, such as "created a project and sent the first event". If you cannot name it, no onboarding example can help you, because you cannot tell whether it worked. For choosing the metrics around it, see onboarding metrics; for the whole programme, see user onboarding.
The examples are patterns, not screenshots of named companies. Their numbers are sample data you can recompute, because published success stories rarely show their method, and one outcome at one company does not transfer.
Which onboarding patterns work, and how do you measure each?
| Pattern | What the user sees | Activation metric it targets | How it usually fails | Measure it with |
|---|---|---|---|---|
| One first action | After sign-up, an empty screen with one task and one button | Share who complete that task in the first session | The task is too big ("set up your workspace") | Step conversion from sign-up to task |
| Checklist with a head start | A 5-item checklist with the first item already ticked | Checklist completion rate | Too many items, or items unrelated to value | Items completed per user; completion rate |
| Goal or role question | One question, then a path tailored to the answer | Activation rate by answer | Four or more questions before any value | Drop at the question; activation by answer |
| Sample data or template | A pre-filled example the user can edit | Time to first real action | Users never replace the sample | Time to first event; share who add their own data |
| Deferred sign-up | Try the product, then ask for an account | Sign-up completion after first use | The product needs an account to work at all | Sign-ups per product use |
| Nudge after silence | A message sent if the first action has not happened in 24 hours | Reactivation of non-starters | The message repeats the welcome | Share of non-starters who return |
Four of these have outside evidence worth knowing:
- The head start works. In a field experiment with 300 car-wash customers, a loyalty card needing eight stamps was compared with a ten-stamp card that came with two stamps already given, so both needed eight more washes. The pre-stamped card made completion more likely and shortened completion time (Nunes and Drèze, Journal of Consumer Research, 2006). In onboarding, a checklist whose first item is already ticked ("account created") borrows the same effect. The authors report that giving a reason for the head start changes the effect, so say why the item is already done.
- Forced accounts cost orders. In a review of 50 studies, 18% of US shoppers who abandoned a cart said the site required them to create an account (Baymard Institute). The same logic applies to product trials: deferring sign-up until after the first action removes one reason to leave.
- Fewer, more specific steps. If each step keeps about 70% of the people who reach it, five steps keep 0.7^5 = 16.8% of them. Cutting one step to four raises that to 0.7^4 = 24.0%.
- One in three changes helps. Of the ideas tested at Microsoft, about one third improved the metric they were meant to improve (Kohavi et al., KDD 2013). Plan to measure, not assume.
| Pattern | Activation metric it targets | How it usually fails |
|---|---|---|
| One first action | Share completing the task in session one | The task is too big |
| Checklist with a head start | Checklist completion rate | Too many items, unrelated to value |
| Goal or role question | Activation rate by answer | Four or more questions before value |
| Sample data or template | Time to first real action | Users never replace the sample |
| Deferred sign-up | Sign-ups after first use | Product needs an account to work |
| Nudge after silence | Reactivation of non-starters | Message repeats the welcome |
Patterns, not named companies; measure each against your own activation event.
What does a before and after look like in numbers?
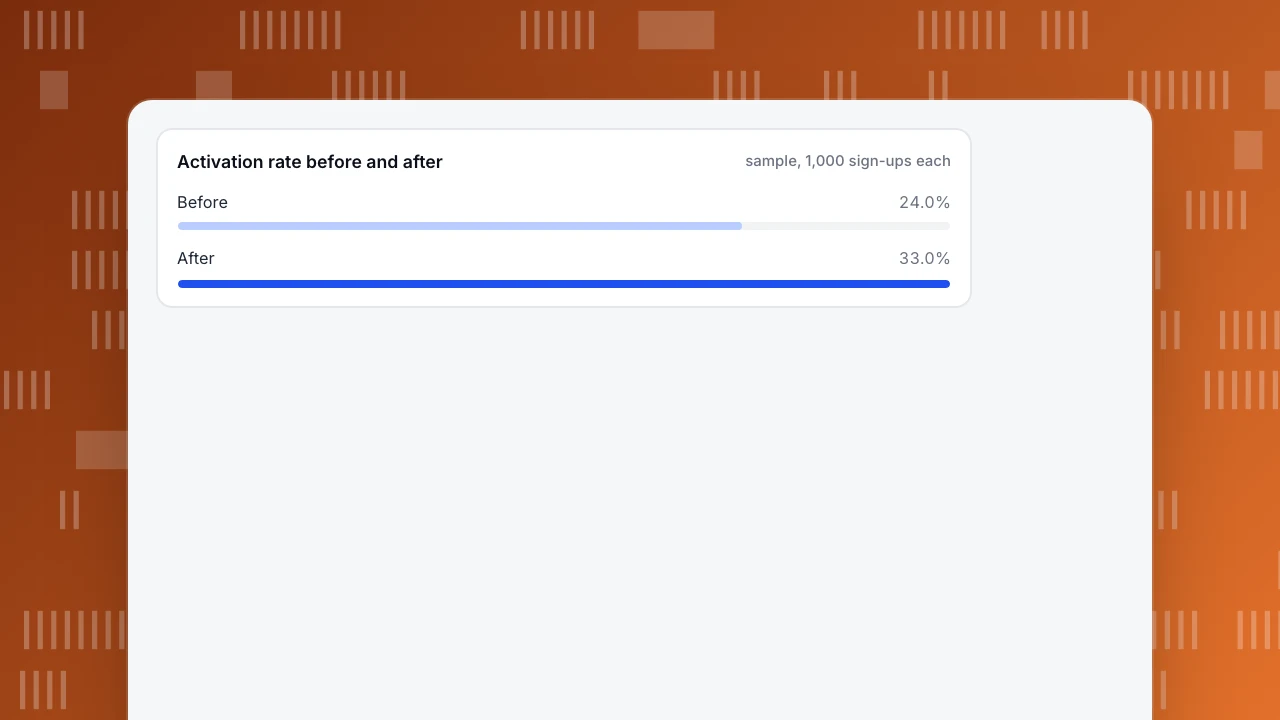
Sample data: a developer-facing product changes its onboarding. It replaces a four-field welcome form with one "create your first project" button and adds a checklist whose first item is pre-ticked. We compare two cohorts of 1,000 sign-ups each.
| Step | Before | After | Step conversion before | Step conversion after |
|---|---|---|---|---|
| Signed up | 1,000 | 1,000 | n/a | n/a |
| Created project | 620 | 710 | 62.0% | 71.0% |
| Installed snippet | 410 | 520 | 66.1% | 73.2% |
| Sent first event | 350 | 470 | 85.4% | 90.4% |
| Activated (3 event types within 7 days) | 240 | 330 | 68.6% | 70.2% |
| Activation rate | 24.0% | 33.0% |
Recompute: 240 ÷ 1,000 = 24.0% and 330 ÷ 1,000 = 33.0%, a gain of 9.0 percentage points, or 37.5% relative (33 ÷ 24 − 1). Is it noise? The pooled rate is (240 + 330) ÷ 2,000 = 28.5%, the standard error is √(0.285 × 0.715 × 2 ÷ 1,000) = 2.02 points, and z = 9.0 ÷ 2.02 = 4.46, far beyond the usual 1.96 threshold. That is a real difference between the cohorts, but not proof that onboarding alone caused it. If the two cohorts came from different periods or traffic sources, check that first.
Where did the gain come from? Mostly the first two steps: "created project" gained 9.0 points and "installed snippet" 7.1 points, while the last step moved 1.6. That points to the form and the checklist, not to the final activation step, and tells you where to look next: step 4 still loses 30% of the people who reach it.
Activation rate before and after
sample, 1,000 sign-ups eachHow do you pick the activation metric?
Compare retention between people who did the candidate action and people who did not. Sample data for the "before" cohort: of 1,000 sign-ups, 240 activated and 163 of them were still active at day 30 (67.9%); of the 760 who did not, 91 were (12.0%). A good activation event shows a large gap like this.
Two warnings. First, the gap proves association, not cause: people who were going to stay anyway are more likely to do everything, a form of selection bias. Second, the event must happen early (within 7 days here) so you can act on it. Pick the earliest event that still separates retained from lost users, test two or three candidates and keep the one with the biggest gap that you can influence.
How do you roll out an onboarding change without fooling yourself?
- Baseline first. Record the funnel for at least two full weeks before changing anything, so weekday patterns are visible.
- Change one thing. Replace the form, or add the checklist, not both, if you can afford the time; otherwise accept that you cannot tell which did the work.
- Compare like with like. Compare cohorts by sign-up week, from the same sources, and exclude bots and internal traffic.
- Pick the decision rule in advance. For example: "keep the change if the activation rate rises by at least 3 points with z above 1.96 after 1,000 sign-ups per arm".
- Look at the next step. If activation rose but day-30 retention did not, the activation event is the wrong one.
- Write down what you learned, including failures. With about one in three changes helping, most of your learning will be what did not work.
What are the common onboarding mistakes?
- Copying a tour. A seven-step tour is rarely the reason people activate; the first action is.
- Asking too much before value. Each field or question before the first action has a cost you can measure on the funnel.
- Measuring completion of the tour instead of activation. A user can finish a tour and never do the valuable thing.
- Treating all sign-ups alike. Compare by source and by goal answer; paid and organic users behave differently.
- Declaring victory on activation. If retention does not follow, you have moved a number without helping anyone.
How do you measure onboarding in TapCub?
TapCub does not build tours, checklists or onboarding emails, and it does not run experiments. It measures what new users did, which is what the sample above needed:
- Set up the events. In All-platform analytics › Data › Tracking plan, record the events you intend to send (sign-up, project created, snippet installed, first event) with an owner and status, and use the real-time validation to see that each event arrives with its required properties. New events land in the Event inbox until someone claims them.
- Build the funnel. In All-platform analytics › Behavior › Behavior analysis, build a funnel from sign-up to the activation event and read the step conversion, as in the table above. Compare two date ranges to see before and after.
- Check retention by group. Create a segment of people who activated and view them as a cohort in the retention report, so the activated-versus-not comparison is on the same data.
- Watch where people stall. Session replay is off by default; once turned on, open recordings of sessions that stopped at the step losing 30%. Identify logged-in users so a person's timeline in All-platform analytics › Users › People shows what they did before and after sign-up.
- Annotate the change. Mark the release in Configuration › Annotations so the comparison is clear later.
FAQ
What is a good example of onboarding?
One that gets a new user to a first valuable action quickly, with the fewest steps and fields before it. In the sample above, replacing a four-field form with one button and adding a pre-ticked checklist raised activation from 24.0% to 33.0%.
What are the best onboarding examples for SaaS?
Look for patterns, not brands: a single first action, a checklist with a head start, a goal question that tailors the path, sample data to edit, and sign-up deferred until after first use. Measure each against your own activation rate.
What are the types of onboarding?
Common types are guided product tours, checklists, interactive walkthroughs, personalised paths, template or sample-data starts and lifecycle messages. They differ in how much they ask of the user before showing value.
How do you measure onboarding success?
Define one activation event, then track the share of sign-ups who reach it within a fixed window, the step conversion on the way, time to first action and whether activated users retain better at day 30.
How long should onboarding take?
As short as it takes to reach the first value. Count steps rather than minutes: at 70% retention per step, five steps keep 16.8% of users and four keep 24.0%.
Sources
- Nunes and Drèze, The Endowed Progress Effect, Journal of Consumer Research 32(4), 2006, checked 2026-11-21
- Baymard Institute: cart abandonment rate statistics, checked 2026-11-21
- Kohavi et al., Online Controlled Experiments at Large Scale (KDD 2013), checked 2026-11-21
Was this article helpful?
We use your answers to fix and expand this page.
Couldn’t send. Please try again in a minute.
Thanks for the feedback. We’ll use it to improve this page.You’ve already sent feedback on this page. Thanks.

Technical Engineer
Focuses on tracking code, SDKs, and API integrations, with practical guidance on implementation checks and troubleshooting.