Try it on your own data
Every report in this article is in the free plan. One snippet for web and apps, up to 10 sites.
Start freePipeline attribution credits the marketing touches behind each sales opportunity with the opportunity's amount, counting touches up to opportunity creation rather than lead creation. In our $30,000 sample, lead-level linear credit gives the nurture email and demo page $0, while opportunity-level credit gives each $6,000.
What you will learn
- Count touches up to opportunity creation, not lead creation, and split the deal amount once across all contacts
- Credits must add up: every model in the sample sums to $30,000; lead-level credit across three contacts reports $90,000
- Set the lookback to at least your 75th-percentile cycle: a 21-day window drops three of five touches
What pipeline attribution credits
Pipeline attribution assigns the value of sales opportunities to the marketing touches that came before them. It answers "which channels and content led to deals that are open or won?" and so it sits one step after lead attribution and one step before revenue attribution:
- Lead attribution credits what brought a person into your database, usually the form fill.
- Pipeline attribution credits the touches behind each opportunity, the moment sales accepts a lead as a real deal, with the opportunity's amount as the value.
- Revenue attribution does the same at closed-won, with the final amount.
The difference matters most in B2B, where a deal has several contacts, a gap of weeks between lead and opportunity, and touches that happen after the lead already exists. For the general idea of credit across touches, see attribution; for the B2B version of the problem, see B2B marketing attribution.
Lead-level versus opportunity-level credit
The core choice is where you count touches and where the value comes from.
| Lead-level credit | Opportunity-level credit | |
|---|---|---|
| Credit unit | One person (lead) | One deal (opportunity) |
| Value shared | A count of leads, or a per-lead value | The opportunity amount, once |
| Touches counted | Up to the moment the lead was created | Up to the moment the opportunity was created |
| Contacts per deal | Each contact is credited separately | All contacts at the account are combined |
| Typical flaw | Overcredits the first form fill; ignores nurture | Needs clean links from contacts to the deal |
The point is not that one is right. Lead-level credit tells you which channels fill the database; opportunity-level credit tells you which channels are present when deals form. Pipeline attribution means the second.
| Lead-level credit | Opportunity-level credit | |
|---|---|---|
| Credit unit | One person (lead) | One deal (opportunity) |
| Value shared | A count of leads, or a per-lead value | The opportunity amount, once |
| Touches counted | Up to lead creation | Up to opportunity creation |
| Contacts per deal | Each credited separately | All contacts at the account combined |
| Typical flaw | Overcredits the first form fill; ignores nurture | Needs clean links from contacts to the deal |
Sample comparison; pipeline attribution means the opportunity-level column.
A worked example: one $30,000 opportunity
Sample data: one $30,000 opportunity and five touches by the buying team over about 44 days, numbered by days before the opportunity was created.
- Paid search click, 44 days before.
- Blog post, 36 days before.
- Webinar sign-up, 30 days before. This is where the lead is created.
- Nurture email click, 18 days before, 12 days after the lead.
- Demo request page, 3 days before.
Credit of the $30,000 under each model, at opportunity level:
| Touch | First touch | Last touch | Linear | Position | Time decay (7-day half-life) |
|---|---|---|---|---|---|
| Paid search click | 30,000 | 0 | 6,000 | 12,000 | 383 |
| Blog post | 0 | 0 | 6,000 | 2,000 | 846 |
| Webinar sign-up | 0 | 0 | 6,000 | 2,000 | 1,533 |
| Nurture email click | 0 | 0 | 6,000 | 2,000 | 5,029 |
| Demo request page | 0 | 30,000 | 6,000 | 12,000 | 22,209 |
| Total | 30,000 | 30,000 | 30,000 | 30,000 | 30,000 |
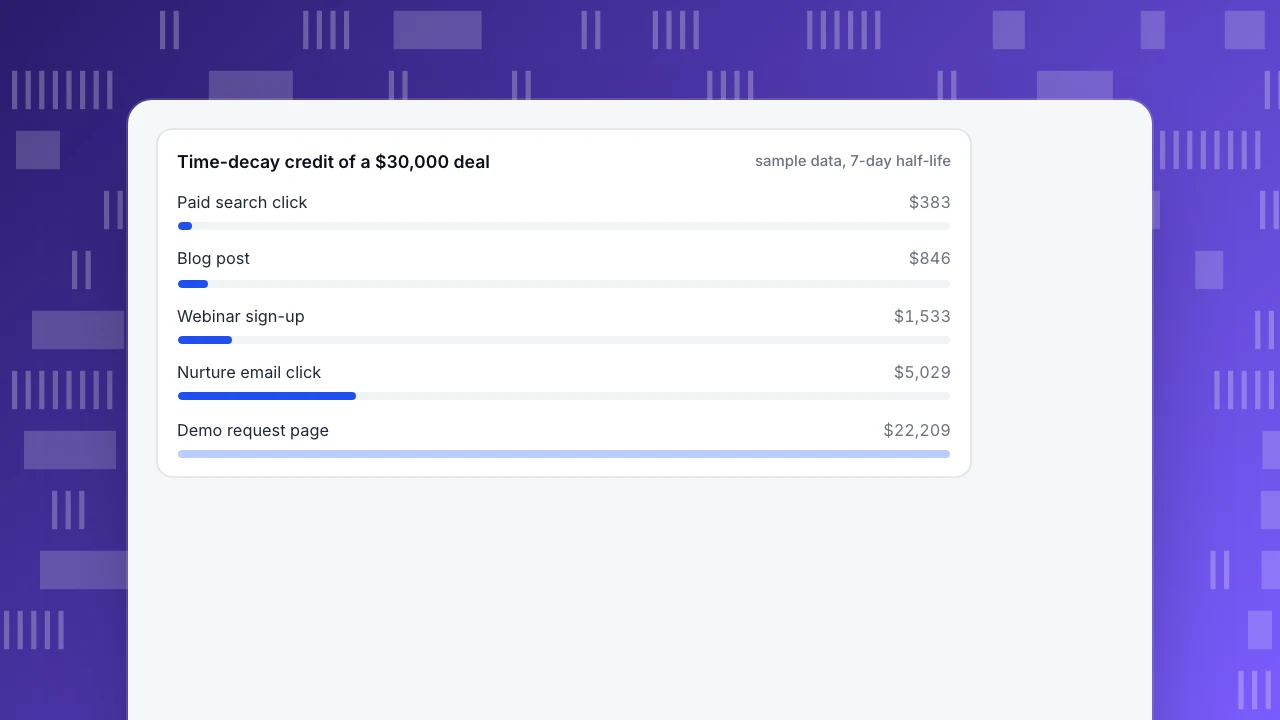
Position-based credit with five touches gives 40% to the first and last (12,000 each) and splits the middle 20% among the other three (2,000 each). Time decay weights each touch by 2 to the power of minus days divided by 7, so the demo page, three days from the end, carries 74% of the total (weights 0.0128, 0.0283, 0.0513, 0.1682 and 0.7430, which add to 1.0036 and are scaled to 100%).
Every column adds up to $30,000. Check that on your own report; if a model's credits do not add up to the deal amount, something is double counted or dropped.
Time-decay credit of a $30,000 deal
sample data, 7-day half-lifeWhat changes at lead level
Now count the same deal at lead level, where touches stop when the lead is created (touch 3).
| Touch | Lead-level linear | Opportunity-level linear |
|---|---|---|
| Paid search click | 10,000 | 6,000 |
| Blog post | 10,000 | 6,000 |
| Webinar sign-up | 10,000 | 6,000 |
| Nurture email click | 0 | 6,000 |
| Demo request page | 0 | 6,000 |
Lead-level linear gives the first three touches $10,000 each and the last two nothing, because they happened after the lead existed. The nurture program and the demo page, which did a lot of work in this deal, look worthless. Opportunity-level credit gives each $6,000.
Multiple contacts: how lead-level credit double counts
B2B deals involve a buying group. Suppose the same $30,000 deal has three contacts: A came from the webinar, B from the demo request and C from a pricing-page visit. If each lead's source is credited with the full deal as "sourced pipeline", the sources are credited $30,000 three times and the report shows $90,000 of pipeline against a $30,000 deal.
Opportunity-level credit prevents this by construction: the deal amount is split once across all touches from all contacts at the account. It is also why the touches have to be linked to the account and not only to individual people.
Which model to use
Choose by the question you are asking:
- "What starts deals?" First touch. It is the cleanest read on discovery, and the worst on closing.
- "What closes deals?" Last touch before opportunity creation. It overcredits the demo page and ignores everything that earned the visit.
- "What is present across the journey?" Linear. It is simple and neutral, and it rewards channels with many cheap touches.
- "What matters at both ends?" Position-based, with 40% each at the ends.
- "What matters recently?" Time decay, when your cycle is short or when the last 2 weeks of nurture are what you want to reward.
Show two or three models side by side. A channel that gets credit under first touch and almost none under last touch is a discovery channel; the reverse is a closing channel; one with credit everywhere is simply busy. Platforms have been narrowing their model lists: Google Ads and Google Analytics 4 both now keep only data-driven and last-click style models, and Google Analytics removed first-click, linear, time decay and position-based as of November 2023. Rule-based models like these therefore usually live in your own analytics.
The window and the clock
Pipeline attribution needs a lookback window that is longer than your buying cycle, or the oldest touches vanish.
Sample data: a deal with touches over 44 days. A 21-day window keeps only touches 4 and 5, so first touch becomes the nurture email click and the paid click, the blog post and the webinar get nothing. A 30-day window adds the webinar sign-up; a 90-day window keeps all five. If your median cycle from first touch to opportunity is 60 days, a 30-day window loses about half of the journey.
Rule: set the window to at least your 75th-percentile cycle length, then check how many opportunities have no touch inside it. A high share of unattributed deals means the window is too short or the identity link is broken.
The data you need before the model
The models are easy. The data is the work.
| You need | Why | Failure looks like |
|---|---|---|
| A stable person ID across anonymous and known visits | To join the touches before and after the form fill | Touches vanish at the form fill |
| An account or company key | To combine contacts of one deal | The same deal credited several times |
| Opportunity created date and amount | The conversion and its value | Credit lands on the wrong week |
| Campaign tags on every link | To tell channels apart | Large "none" and "direct" rows |
Reporting rules that keep the numbers honest
- Credits must add up to the opportunity amount, per model.
- Report sourced and influenced separately. Sourced pipeline is the first-touch share; influenced pipeline is any deal with at least one touch from the channel.
- Freeze the amount at creation for pipeline, and report revenue separately at close. Amounts change; your pipeline report should not rewrite itself.
- Do not compare models you did not label. Put the model name in the title of every chart.
- Audit by hand once a quarter. Pick 10 closed deals, list their touches from the raw records and compare with the report. If more than 2 of the 10 differ, fix the links between visits, contacts and accounts before you touch the model.
Measuring this in TapCub
TapCub measures the web and product side of the journey. It does not read your CRM stages, and it does not store opportunities or amounts by itself.
- Make opportunity creation a measurable goal: have your CRM or backend send an
opportunity_createdevent to the server-events endpoint with the person's login ID, and with the account key throughgroupif you use accounts. Keep browser pageviews on the browser script, as the docs advise. - In All-platform analytics › Behavior › Behavior analysis, open the attribution model and choose that event as the goal.
- Choose the touch dimension: channel by default, or UTM source, UTM campaign, referrer domain or landing page. Set the lookback; the default is 30 days and it can go up to 90, with the conversion session included.
- Select several models at once: first touch, last touch, linear, position and time decay each get a column, so a channel that only assists stands out.
- Read the totals: conversions, attributed conversions, conversions with no touch and the average number of touches. A conversion with no session inside the window stays unattributed.
Attribution here uses sessions before the conversion; it is not an install postback. Up to 50,000 conversions are scored. TapCub does not move deals between stages and does not decide which model is right.
FAQ
What is pipeline attribution?
It assigns the value of sales opportunities to the marketing touches that came before them, so you can see which channels and content are present when deals form. It differs from lead attribution, which credits what created the lead.
What is the difference between lead-level and opportunity-level attribution?
Lead-level credit counts touches up to the lead's creation and credits each person separately; opportunity-level credit counts touches up to the opportunity's creation and splits the deal amount once across the whole buying group.
Which attribution model is best for pipeline?
None is right for every question. Use first touch for what starts deals, last touch for what closes them, and compare linear or position-based credit to see what is present in between.
How long should the lookback window be?
At least your 75th-percentile cycle from first touch to opportunity. In the example, a 21-day window dropped three of five touches, and a 90-day window kept all of them.
Can I attribute pipeline without a CRM?
Only up to the point your analytics sees. If opportunity creation is not sent as an event, you can attribute sign-ups or demo requests but not the deal itself.
Sources
- Google Ads Help. About attribution models: last click and data-driven remain; first click, linear, time decay and position-based are no longer supported. Checked 2026-11-21.
- Analytics Help. Attribution models: data-driven and last-click models; first click, linear, time decay and position-based removed as of November 2023. Checked 2026-11-21.
Was this article helpful?
We use your answers to fix and expand this page.
Couldn’t send. Please try again in a minute.
Thanks for the feedback. We’ll use it to improve this page.You’ve already sent feedback on this page. Thanks.

Product Analyst
Focuses on event analysis, conversion funnels, and retention, using clear metric definitions and structured analysis to explain product performance.