Try it on your own data
Every report in this article is in the free plan. One snippet for web and apps, up to 10 sites.
Start freeData integration problems rarely raise errors; they show up as two systems disagreeing. Reconcile one unit over one window, join on a stable ID and classify every unmatched row. In the sample, a 6.0% net gap (940 vs 1,000 orders) hides 140 problem rows, a 14.0% gross mismatch, because 40 duplicates offset some of the 100 missing orders.
What you will learn
- Report net and gross mismatch: −6.0% net hides 14.0% gross when duplicates offset missing rows
- Retries cause duplicates and lost deliveries: key every insert on the event ID and acknowledge before processing
- Daily totals reveal time-zone and delivery issues that a monthly total hides
How do you tell that a data integration is broken?
Most integration problems do not raise an error. The pipeline runs, the dashboard loads, and the numbers are quietly wrong. The first diagnostic is a reconciliation: pick one unit (orders, signups, tickets), one window (a calendar month in one time zone) and count it in both systems.
Sample data: your billing system recorded 1,000 orders in the month; your analytics tool shows 940.
- Net mismatch = (940 − 1,000) ÷ 1,000 = −6.0%
That looks like one problem of 6%. It is not. Break it down by joining the two lists on the order ID and classifying every row that is on one side only:
| Bucket | Orders | What it means |
|---|---|---|
| Missing in analytics: tracking blocked in the browser | 45 | Never sent |
| Missing in analytics: delivery failed or timed out | 30 | Sent, never arrived |
| Missing in analytics: pushed into the next month by time zone | 15 | Arrived, but on the wrong side of the window |
| Missing in analytics: test orders only in billing | 10 | Not a real gap |
| Extra in analytics: duplicates | 40 | Same order counted twice |
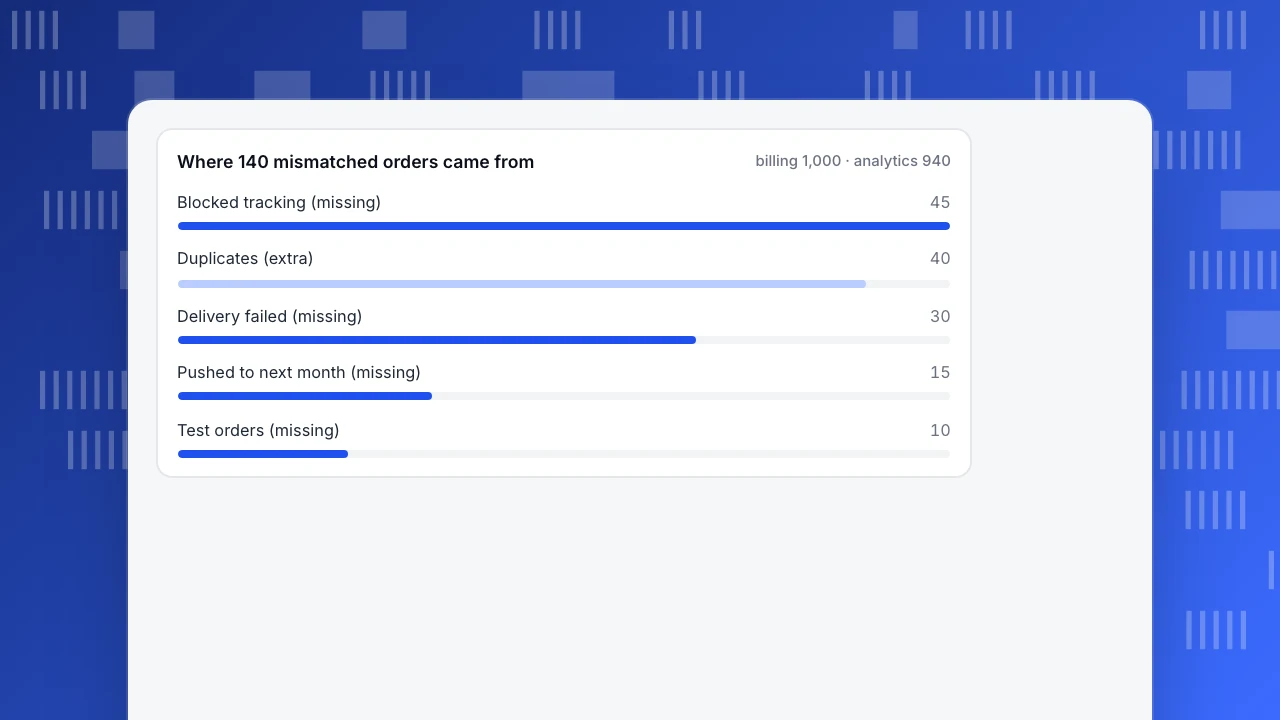
Missing = 45 + 30 + 15 + 10 = 100, extra = 40, so 1,000 − 100 + 40 = 940. The gross problem is 100 + 40 = 140 rows, or 14.0%, more than twice the net 6.0%, because duplicates offset some of the missing rows. A small net gap can hide a large gross one, so always report both.
Where 140 mismatched orders came from
billing 1,000 · analytics 940What are the eight common failure modes?
| # | Failure | Signal in the data | Typical fix |
|---|---|---|---|
| 1 | Duplicate deliveries | Same event ID or order ID appears twice | Store processed event IDs and ignore repeats |
| 2 | Lost deliveries | Counts lower on one side with gaps in time | Respond fast, retry, resend missing events |
| 3 | Out-of-order events | "Refunded" processed before "paid" | Do not rely on arrival order; fetch current state |
| 4 | Identity mismatch | Joins on email hit 70% of rows; on user ID 95% | Pick one key; hash and normalize before joining |
| 5 | Time-zone and day-boundary shifts | Daily totals differ, monthly totals nearly match | One reporting zone for both sides |
| 6 | Schema drift | A field's null rate jumps overnight | Field-level monitoring; agree changes in advance |
| 7 | Definition mismatch | Revenue includes tax on one side only | Write down each metric's definition on both sides |
| 8 | Caps and truncation | Round numbers: exactly 100,000 rows or 50,000 results | Know the limits; split loads; watch the row counts |
Use these if-then rules to pick the first suspect:
- If monthly totals match but daily totals do not, suspect time zone or late data.
- If one side is higher and the extra rows share IDs, suspect duplicates.
- If one side is lower and the missing rows cluster in time, suspect an outage or lost deliveries.
- If the gap exists only for one platform or one segment, suspect identity.
- If every row differs by a similar ratio, such as the sales-tax rate, suspect definition.
The next sections take the failures in the order that usually pays off, starting with the biggest buckets in the sample.
| Failure | Signal in the data | Typical fix |
|---|---|---|
| Duplicate deliveries | Same event or order ID twice | Store processed IDs and ignore repeats |
| Lost deliveries | Lower count, gaps in time | Respond fast, retry, resend |
| Identity mismatch | Join rate 70% on email vs 95% on user ID | One stable key, normalize before hashing |
| Time-zone shift | Daily totals differ, monthly nearly match | One reporting zone |
| Definition mismatch | Same gap ratio on every row | Write the definition on both sides |
| Caps and truncation | Exactly 100,000 rows or 50,000 results | Know limits, compare row counts |
Sample data: join rates and counts are illustrative; the failure list covers the six modes with the clearest signal.
How do duplicates and lost deliveries happen?
Event-driven integrations (webhooks, server-to-server calls) are designed to retry. Stripe's documentation says that a webhook endpoint "might occasionally receive the same event more than once", recommends logging the event IDs you have processed, and says it attempts delivery for up to three days with exponential backoff if your endpoint does not return a success status. It also states that your endpoint must quickly return a 2xx status before running complex logic, or the delivery times out.
Both halves of the sample's gap come from that behavior:
- Duplicates (40 extra orders). The sender retried after a slow response, and the receiver stored the retry as a new order. The fix is idempotency: Stripe's API accepts idempotency keys of up to 255 characters, saves the result of the first request and returns it for retries, and removes keys after at least 24 hours. Apply the same idea on your side: key every insert on the event or order ID.
- Lost deliveries (30 missing orders). The receiver was down, or timed out while doing heavy work before answering. Acknowledge first and process in a queue, then reconcile daily so a gap does not live for a month.
Out-of-order events come from the same place: Stripe states it does not guarantee delivery in the order events were generated, and that the created timestamp is in seconds so distinct events can share it. Do not use arrival time or created to decide which event is newer; fetch the current object from the source system instead.
Why do identity and time zone and definition errors survive for months?
These three do not look like errors, which is why they last.
Identity. One person can appear as a user ID, an email hash, a device ID and an account ID. Compute the join rate: of 1,000 orders, how many match a known person in the other system? Sample data: joining on email matched 700 (70.0%) and joining on user ID matched 950 (95.0%). A 25-point gap is a sign that email is missing or formatted differently on many rows. Normalize case and whitespace before hashing, and join on the most stable key.
Time zone. An order at 23:30 in one time zone is already tomorrow in another. In the sample, 15 orders placed in the last hours of the month fell into the next month on the analytics side. Daily totals can differ by several percent while the monthly total looks nearly right, so reconcile daily at first. Choose one reporting time zone and state it next to every number.
Definition. "Revenue" is a good test. Stripe's own MRR definition, for example, leaves out trials, one-time invoices, taxes and metered billing. If analytics shows gross order value with tax and billing shows subscription revenue without it, no technical fix will make them match. Write the definition of each shared metric on both sides.
What do caps and late data and schema drift look like?
Caps and truncation. Numbers that stop at a round figure are suspicious. A file import that accepts at most 100,000 rows, or a query that returns at most 50,000 rows, silently drops the rest of a bigger load unless you compare row counts. Always record "rows in" and "rows out" for every batch.
Late data. Backfills often rewrite time. In TapCub's server API, for instance, an event whose time is more than 72 hours from the server clock is rewritten to the receive time and flagged. A batch of older events then lands on the day it was received, which shifts daily totals without any error.
Schema drift. A field is renamed, a type changes from number to text, or a value gains a new format. The signal is a field's null rate or distinct-value count jumping. Track those two numbers per field per day; a jump from 2% null to 35% null tells you the day the change shipped.
What is a repeatable way to diagnose a mismatch?
- Pick one unit and one window. One month, one time zone, one definition of "order".
- Count both sides, and the gap. Report net and gross, as in the sample: −6.0% net, 14.0% gross.
- Join on the stable ID. List rows only in A, only in B, and in both with different values.
- Classify every row into a bucket: blocked, failed, time window, test data, duplicate, definition. Leave nothing as "other" above 5% of the gap.
- Fix the largest bucket first. By size in the sample: blocked tracking (45), then duplicates (40), then lost deliveries (30), then the time-zone shift (15) and test orders (10).
- Re-run the same reconciliation next period. Set a threshold, such as gross mismatch above 3%, and be told when it is crossed.
For the architecture choices that prevent these problems, see data integration approaches; for the definition, data integration.
How do you spot these problems in TapCub?
The reconciliation above, applied to TapCub as the receiving side.
- In All-platform analytics › Data › Data quality check ingestion warnings and collector rejects: they are listed by reason and day, such as domain mismatch, exclusion rule, monthly quota, rate limit, invalid payload and bots. A jump in one reason explains a "missing" bucket, and clock skew shows up under ingestion warnings.
- Open All-platform analytics › Data › Tracking plan and turn on live verification (24 h). Each planned event shows hits in 24 hours and the completeness of its required properties, so a field that stopped arriving shows as low completeness.
- Check All-platform analytics › Data › Event inbox for events that arrived but were never claimed: renamed events from schema drift usually land here.
- For server-side events, send an
insert_idand keeptimewithin 72 hours of the server clock. For older history, use log import or CSV events on All-platform analytics › Data › Data import, where a file holds at most 100,000 rows. - Call
tapcub.loginso web, app and server events join on one person, then rerun your join-rate check.
TapCub tells you what it received and what it rejected. It does not connect to your billing system and reconcile for you, so keep the order or ticket list from the source system as your reference.
FAQ
What are the most common data integration problems?
The most common are duplicate and lost deliveries, mismatched identities across systems, time-zone and definition differences, schema changes that nobody announced, and silent caps on row counts. Most show up as numbers that are slightly off, not as errors.
How do you troubleshoot a data integration?
Count one unit in both systems for one window, join on a stable ID, classify every row that is on only one side, fix the largest bucket first and rerun the same reconciliation. Report net and gross mismatch.
Why do the numbers differ between two systems?
Usually because of different definitions, time zones, identity keys, duplicate or missing events, or filters such as bots and test data. A net difference of 6% can hide a gross difference of 14% when errors offset each other.
How do you prevent duplicate data in an integration?
Make inserts idempotent: key every record on the event or order ID, store the IDs you have processed and ignore repeats. Stripe documents the same pattern for webhooks and API requests.
How often should you reconcile?
Daily at first, because daily totals expose time-zone and delivery problems that a monthly total hides. Move to weekly once the gross mismatch stays under your threshold.
Sources
- Stripe, Receive Stripe events in your webhook endpoint: duplicate events, retries for up to three days, no ordering guarantee, quick 2xx response. Checked 2026-11-21.
- Stripe, Idempotent requests: idempotency keys up to 255 characters, saved results, key pruning after at least 24 hours. Checked 2026-11-21.
- Stripe, Understanding monthly recurring revenue (MRR) and annual recurring revenue (ARR): MRR excludes trials, one-time invoices, taxes and metered billing. Checked 2026-11-21.
Was this article helpful?
We use your answers to fix and expand this page.
Couldn’t send. Please try again in a minute.
Thanks for the feedback. We’ll use it to improve this page.You’ve already sent feedback on this page. Thanks.

Product Experience Specialist
Writes about product experience, practical workflows, and growth, turning complex processes into clear steps for everyday decisions.