Try it on your own data
Every report in this article is in the free plan. One snippet for web and apps, up to 10 sites.
Start freeData misuse is either drawing a misleading claim from sound data, such as a truncated axis or a cherry-picked window, or using personal data beyond the purpose it was collected for. The first causes wrong decisions; the second harms people and can breach laws such as GDPR. Below: seven examples with numbers you can recompute, a rule that prevents each one and a checklist to run before publishing.
What you will learn
- Bars start at zero; a 6% rise drawn on a 980 axis looks like 4×
- A total can reverse inside every group: Berkeley 1973 shows 44.5% vs 30.3% overall and 38.8% vs 42.9% on a common applicant mix
- Tie each personal-data field to a stated purpose; a new use is a new decision
What counts as data misuse?
Data misuse comes in two kinds, and they need different fixes.
- Misusing the analysis. The data is fine but the claim drawn from it is not: a truncated axis, a cherry-picked window, a cause read into a correlation. The harm is a wrong decision.
- Misusing the data itself. Personal data collected for one purpose is used for another, or more is collected than the purpose needs. The harm is to the people in the data, and in some regions it is also a legal breach.
On the second kind, the EU's GDPR is specific. Article 5(1)(b) requires personal data to be "collected for specified, explicit and legitimate purposes" and not further processed in a way incompatible with them, and Article 5(1)(c) requires data to be "adequate, relevant and limited to what is necessary" for those purposes. The seven examples below are drawn from both kinds. Each shows the mistake with numbers (Sample data unless stated), then the rule that prevents it. For the cognitive side of the same problem, see types of bias; for numbers that disagree between tools, see data discrepancies.
Example 1: a truncated axis makes 6% look like 300%
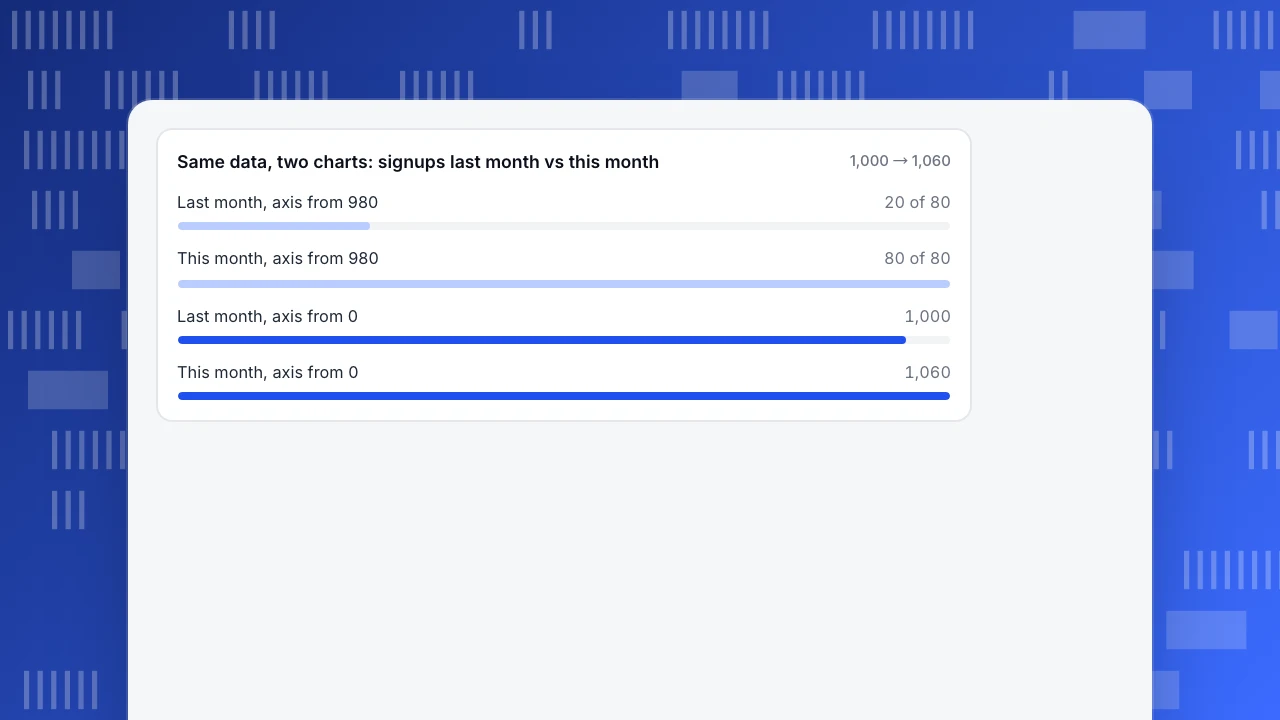
Sample data: signups were 1,000 last month and 1,060 this month, a rise of 6%. Draw the bar chart with the vertical axis starting at 980 and the bars are 20 units and 80 units tall. The second bar looks four times the first.
| View | Last month | This month | What the eye reads |
|---|---|---|---|
| Axis from 980 | 20 units tall | 80 units tall | 4× growth |
| Axis from 0 | 1,000 units tall | 1,060 units tall | 6% growth |
Rule: bars encode length, so bar charts start at zero. If the interesting change is small, use a line chart (where position, not length, carries the value) and label the change as a percentage next to it. Dual-axis charts need the same care: rescale one axis and two unrelated lines will appear to move together.
Same data, two charts: signups last month vs this month
1,000 → 1,060Example 2: the total says one thing, every group says the opposite
This is Simpson's paradox, and the best-known data is the 1973 graduate admissions at UC Berkeley, analysed by Bickel, Hammel and O'Connell (1975). Overall, men were admitted at a clearly higher rate than women. The table shows the six largest departments, as tabulated in the published data:
| Department | Men applicants | Men admitted | Women applicants | Women admitted |
|---|---|---|---|---|
| A | 825 | 62% | 108 | 82% |
| B | 560 | 63% | 25 | 68% |
| C | 325 | 37% | 593 | 34% |
| D | 417 | 33% | 375 | 35% |
| E | 191 | 28% | 393 | 24% |
| F | 373 | 6% | 341 | 7% |
Weighted by applicants, these six departments admit 44.5% of 2,691 men and 30.3% of 1,835 women, a gap of 14 points against women. Yet in four of the six departments women were admitted at a higher rate. The reason is where people applied: most women applied to departments with low admission rates (C to F), most men to departments with high ones (A and B). Apply the same mix of applicants to both groups, so each department counts by its total applicants, and the rates become 38.8% for men and 42.9% for women, a reversal.
Rule: before you quote a gap between two groups, split it by the biggest likely driver (here, department) and check whether the direction holds inside each split. Either number can be the honest one, so decide which comparison answers the question you are asking.
| Example | What goes wrong | Rule |
|---|---|---|
| Truncated axis | 6% rise drawn as 4× | Bars start at zero |
| Simpson's paradox | Total reverses inside groups | Split by the biggest driver |
| Cherry-picked window | Best of 9 windows reported | Fix the window before looking |
| Correlation as cause | Self-selected groups compared | Matched or held-out comparison |
| Tiny samples | 3 vs 2 signups called 50% better | Show counts and intervals |
| Mean of skewed data | $114.53 mean vs $30 median | Report the median |
| Repurposed personal data | Receipt email used for ad ranking | One-line purpose per field |
Run the seven-point checklist before publishing any number.
Example 3: picking the window that tells the story
Sample data: weekly conversion rate over 12 weeks (%): 2.1, 2.4, 2.0, 2.6, 3.1, 2.2, 2.0, 1.9, 2.3, 2.2, 2.5, 2.1. The 12-week average is 2.28%. Search every 4-week stretch and the best is weeks 2 to 5: 2.53%, "11% above average". The most recent four weeks average 2.28%, with no change at all.
Rule: fix the window and the comparison before you look. Compare like with like (same length, same season) and show the whole series next to any highlighted stretch. If you try nine windows and report the best one, the result was selected, not found.
Example 4: a correlation presented as a cause
Sample data: of 500 users who tried a new feature, 300 were still active after 30 days (60%); of 4,500 who did not, 1,350 were (30%). "The feature doubles retention" is the headline. But users who try new features are usually the keen ones, who would have stayed anyway; the feature may add little or nothing.
Rule: a gap between self-selected groups measures who chose, not what the choice did. Compare people who had the same chance to try it (a holdout, or a matched group with similar prior activity), and call the raw gap an upper bound.
Example 5: percentages from tiny samples
Sample data: 3 of 50 visitors signed up from page A (6%) and 2 of 50 from page B (4%). "Page A converts 50% better." One more signup flips it. The 95% Wilson intervals are 2.1% to 16.2% for A and 1.1% to 13.5% for B, which overlap almost completely.
Rule: quote the counts next to the rate, and for any group under a few hundred visitors show an interval or say the sample is small. See margin of error and statistical power.
Example 6: an average that no customer matches
Sample data: 15 orders worth $18, 20, 22, 24, 25, 26, 28, 30, 35, 40, 45, 50, 60, 95 and $1,200. The mean is $114.53; the median is $30. One bulk order pulls the mean to almost four times the median, and 14 of 15 customers spent less than the mean.
Rule: for skewed numbers like order value, report the median and a spread (for example the 25th to 75th percentile), and say how many outliers were removed and why. Here the middle half of orders ran from $24.50 to $47.50, which describes a typical customer far better than a mean of $114.53.
Example 7: using personal data for a purpose people did not agree to
A shop collects an email address to send a receipt. Later, the marketing team uploads the same list to target ads, and the analytics team joins it to behaviour data to rank people by predicted spend. Nobody stole anything, and the data is still misused: the purpose changed. Under GDPR Article 5(1)(b), further use must be compatible with the original purpose, and ranking people by predicted traits is "profiling", defined in Article 4(4) as automated processing used to evaluate personal aspects such as preferences, behaviour or location.
A related mistake is collecting more than the question needs. If you only want to know whether a form was submitted, you do not need what people typed into it.
Rule: for each field you collect, write the purpose in one line. If a new use is not on the list, treat it as a new decision, with a new notice or consent where the law requires it. Collect the least that answers the question.
A checklist before you publish a number
- Axis and scale. Do bars start at zero? Is the scale the same on side-by-side charts?
- Base and window. Is the denominator named? Was the window fixed before looking?
- Splits. Does the gap hold inside the largest subgroup (department, channel, device)?
- Sample. Are counts shown? Is any group small enough to need an interval?
- Cause. Did people choose their group? If so, label it as association.
- Average. Is the distribution skewed? Show the median.
- Purpose. Is every personal-data field tied to a stated purpose and a retention period?
Guarding against both kinds in TapCub
Take the sign-up funnel from the examples. You want honest numbers and a minimal footprint.
- Show the counts. In All-platform analytics › Behavior › Behavior analysis, a funnel lists entered, converted and the rate for each step. Quote the counts with the rate, as in the small-sample example.
- Keep the window honest. Set the date range before reading the result and mark launches with Configuration › Annotations, so a change in the series is explained rather than chosen.
- Keep bots out of the base. Web analytics › Bots counts crawlers separately, so they do not inflate visitors or deflate conversion.
- Split before you compare. Apply a segment (All-platform analytics › Users › Segments & tags) to the same funnel to check that a gap holds inside each group.
- Limit what is collected. Configuration › Privacy center sets the collection tier, retention and data-subject requests, and form tracking, when turned on, records only the form's id, name and action, never what people typed. Public sharing in Configuration › Settings › Public sharing lets you choose which modules to expose, with an optional password and a day limit; visitor lists and sessions cannot be shared.
TapCub does not tell you whether a comparison is causal; that judgement stays with you and the checklist above.
FAQ
What is data misuse?
Data misuse means either drawing a misleading claim from sound data (a truncated axis, a cherry-picked window, a correlation read as a cause) or using personal data beyond the purpose it was collected for. The first leads to wrong decisions; the second harms people and can breach laws such as GDPR.
What are examples of misleading data analysis?
Starting a bar chart's axis at 980 so a 6% rise looks four times larger, comparing totals when every group shows the opposite (Berkeley 1973), reporting the best of nine possible windows, and quoting a mean of $114.53 when the median order is $30.
Is using customer data for a new purpose misuse?
It can be. Under GDPR Article 5(1)(b), personal data collected for specified purposes may not be further processed in an incompatible way. A receipt email reused for ad targeting and ranking is the typical case. Check compatibility, or get fresh consent, before the new use.
How do you avoid misusing data?
Fix the window and comparison before looking, start bars at zero, show counts and intervals for small groups, split large gaps by the biggest driver, and tie every personal-data field to a stated purpose. Review with the checklist before publishing.
Sources
- P. J. Bickel, E. A. Hammel & J. W. O'Connell. Sex Bias in Graduate Admissions: Data From Berkeley. Science 187(4175), 1975, 398–404. Department figures as tabulated in the Simpson's paradox reference (Wikipedia, checked 2026-11-21); weighted rates recomputed here.
- GDPR. Article 5: principles relating to processing of personal data. Purpose limitation (1)(b) and data minimisation (1)(c). Checked 2026-11-21.
- GDPR. Article 4: definitions. Definition of profiling in 4(4). Checked 2026-11-21.
Was this article helpful?
We use your answers to fix and expand this page.
Couldn’t send. Please try again in a minute.
Thanks for the feedback. We’ll use it to improve this page.You’ve already sent feedback on this page. Thanks.

Data Engineer
Writes about event design, data quality, and collection workflows, with verifiable implementation methods for reliable analytics.