Try it on your own data
Every report in this article is in the free plan. One snippet for web and apps, up to 10 sites.
Start freeData pipeline monitoring is a short set of automatic checks that tell you when data is late, the wrong size, the wrong shape or the wrong value: freshness, volume against a same-weekday baseline, completeness, duplicates and ranges. Run status alone is not enough. This guide gives starting thresholds, a worked bad week and a backtest step.
What you will learn
- Five checks cover most incidents: freshness, volume, completeness, duplicates and value ranges; each gets a warn and an alert level
- Compare volume with the median of the same weekday: a flat 80% rule alerts every weekend in the sample, a weekday baseline does not
- Backtest each rule over 28 days before enabling it and give every alert an owner and a first step
What a pipeline can get wrong
Data pipeline monitoring is a set of automatic checks that tell you when data arrives late, in the wrong amount, in the wrong shape or with wrong values, before someone notices a broken dashboard. A job that finishes with a green "success" status can still deliver nothing useful, so run status alone is not monitoring.
Five failure modes cover most incidents:
| Failure | What you see | Check that catches it |
|---|---|---|
| Late | Yesterday's numbers are missing at 9 am | Freshness |
| Missing or surging | Volume far below or above normal | Volume against a baseline |
| Wrong shape | A required field is empty or a type changed | Schema and completeness |
| Duplicated | Counts jump, totals double | Duplicate rate on a unique ID |
| Wrong values | Negative revenue, dates in the future | Range and sanity rules |
The next sections give each check a starting threshold. Treat the numbers as defaults to tune, not as standards.
Freshness: how old is the newest data
Freshness is the time since the most recent record was loaded. It is the cheapest check and catches the most common failure, a job that stopped. Google Cloud's guidance on pipeline metrics describes the same idea as the age of the most recent fully processed item, and treats it as a latency signal.
Set two levels per feed, based on how often the feed should update. The dbt documentation's own example configures a source to warn after 12 hours and fail after 24 hours; that suits a feed that should update daily. A reasonable starting rule:
| Expected update | Warn after | Error after |
|---|---|---|
| Every 5 minutes | 15 minutes | 30 minutes |
| Hourly | 2 hours | 4 hours |
| Daily | 26 hours | 36 hours |
The rule: warn at about twice the expected gap and error at about four times, with a little extra for a daily feed so that a slow job does not page anyone at 6 am. Measure from an event or load timestamp, not from the time the check runs.
Volume: compare with the same weekday
Volume checks compare today's record count with what is normal for that day. A flat threshold fails because most data has a weekly pattern. Sample data: four weeks of daily event counts give these same-weekday medians.
| Day | Median of last 4 weeks | Warn below 80% | Alert below 60% |
|---|---|---|---|
| Mon | 10,250 | 8,200 | 6,150 |
| Tue | 10,350 | 8,280 | 6,210 |
| Wed | 10,275 | 8,220 | 6,165 |
| Thu | 10,250 | 8,200 | 6,150 |
| Fri | 9,975 | 7,980 | 5,985 |
| Sat | 7,275 | 5,820 | 4,365 |
| Sun | 7,150 | 5,720 | 4,290 |
A flat rule shows why this matters. The mean of the seven medians is 65,525 ÷ 7 = 9,361 a day. A flat "alert below 80% of average" threshold is 7,489, which Saturday (7,275) and Sunday (7,150) fall under every week. Same-weekday medians give weekends their own baseline and remove those false alarms.
Use the median, not the mean, so that one past outage does not drag the baseline down. Add an upper bound as well, at 150% for example, because a surge can mean duplicates or a bot.
| Day | Median of last 4 weeks | Warn below 80% | Alert below 60% |
|---|---|---|---|
| Mon | 10,250 | 8,200 | 6,150 |
| Wed | 10,275 | 8,220 | 6,165 |
| Sat | 7,275 | 5,820 | 4,365 |
| Sun | 7,150 | 5,720 | 4,290 |
Same-weekday median of four weeks; add an upper bound near 150% to catch surges and duplicates.
Reading a bad week
Sample data: a fifth week is compared with the table above.
| Day | Events | % of baseline | Status |
|---|---|---|---|
| Mon | 10,280 | 100.3% | OK |
| Tue | 10,330 | 99.8% | OK |
| Wed | 5,400 | 52.6% | Alert |
| Thu | 10,150 | 99.0% | OK |
| Fri | 9,890 | 99.1% | OK |
| Sat | 7,280 | 100.1% | OK |
| Sun | 0 | 0% | Alert |
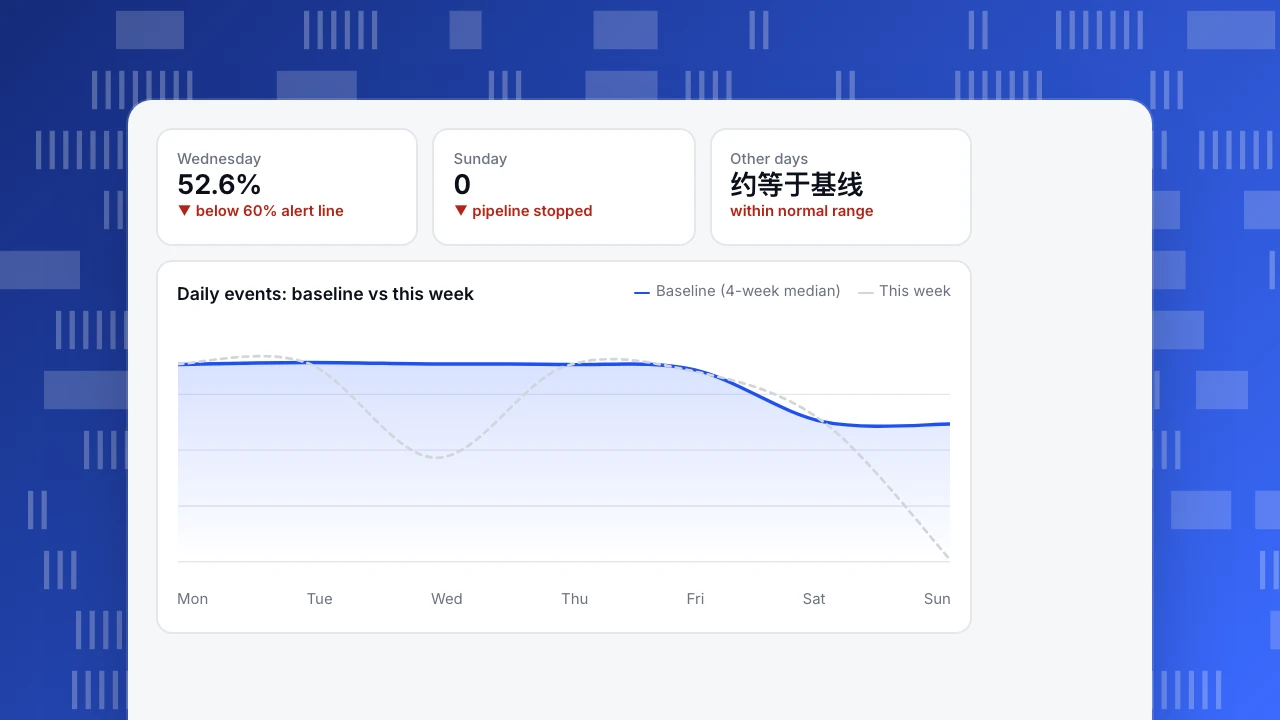
Wednesday at 52.6% is below the 60% line, so someone is told the same day. Sunday at zero is a stopped pipeline; a freshness check on an hourly feed would have caught it within 4 hours instead of waiting for the daily total. The two alerts have different causes (a partial outage and a full stop), and the table is how you tell them apart. A volume check on a daily total is a backstop, not the fastest alarm.
Wednesday
52.6%
▼ below 60% alert line
Sunday
0
▼ pipeline stopped
Other days
约等于基线
within normal range
Daily events: baseline vs this week
Baseline (4-week median)This weekSchema and completeness: is the shape still right
Schema checks protect against silent breakage after a release. Three checks cover most cases:
- Required fields present. For each important event, the share of rows where the required properties are filled. Alert if it drops below 99% for fields used in revenue or conversion numbers.
- Type stability. A field that was a number and now arrives as text breaks sums without raising an error.
- New or missing events. An event name that appears for the first time, or one that stops, is usually a release you did not know about.
Sample data: 2,000 order events arrive in a day and 1,940 have a revenue value. Completeness is 1,940 ÷ 2,000 = 97.0%. Against a 99% line that is an alert, and 60 orders are missing revenue. Fix the cause in the sending code, then decide whether to backfill.
Duplicates and value ranges
A duplicate check counts repeated unique IDs. Sample data: 10,300 events in a day with 103 repeated event IDs is 103 ÷ 10,300 = 1.0%. A starting rule is warn above 0.5% and alert above 2%, since a retry loop or double-firing tag can multiply counts quickly.
Range rules catch values that are possible but wrong: negative prices, an order total of zero, timestamps in the future or more than a day old, and country codes outside a list. Write five rules for the fields that feed your most important metric and add one only when an incident shows a gap.
Lag and errors: the other two signals
Google's SRE guidance describes four golden signals for services: latency, traffic, errors and saturation. For a pipeline they translate directly. Freshness is latency, volume is traffic, failed records and job errors are errors, and a growing backlog of unprocessed items is saturation.
Track error rate as failed records divided by attempted records. A starting rule is warn at 1% and alert at 5% for a feed where a failed record is lost. For queue-based pipelines, alert when the oldest unprocessed item is older than your freshness error level, because that is the earliest sign of a backlog.
Who gets told, and how
The SRE book advises that every page should be urgent and actionable, and that subcritical problems belong on dashboards or in tickets rather than in noisy email. Apply that with two tiers:
| Level | Meaning | Where it goes |
|---|---|---|
| Warn | Worth looking at today | Team channel or ticket |
| Alert | Reports are wrong now | Named owner, immediate notification |
Every alert needs an owner and a first step written next to the rule. An alert with no owner is a notification nobody acts on.
Tune thresholds with a backtest
Before enabling a rule, replay it over the last 28 days. Count how many times it would have fired and compare with the incidents you actually know about. If it fires more than once a week with no real incident, loosen it; if a known incident did not fire, tighten it. Sample data: the 80% warn line over the four sample weeks fires zero times, and the 60% alert line also zero, which is the result you want from a quiet month.
Review every alert that fired in the past month and write one of three labels on it: real, false or unclear. Retire or change any rule where more than half the alerts were false.
What to do when an alert fires
A short runbook turns an alert into a fix. Write these four steps next to every alert rule:
- Confirm it is real. Check the source system for the same period. If the source also shows a drop, the pipeline is fine and the business changed; if the source is normal, the pipeline lost data.
- Find where it stopped. Walk the chain in order: sender, collection endpoint, queue, storage, reports. The first stage whose count is lower than the one before it is where data is lost.
- Fix and mark it. Repair the cause, then add an annotation with the date range so nobody reads the gap as a business trend.
- Decide on backfill. If the lost events can be replayed, replay them once and recheck the counts; if not, record the gap as permanent.
In TapCub
TapCub does not monitor your warehouse or your ETL jobs; it monitors the events arriving into TapCub, which is the first step of the pipeline for web, app and server data.
- In All-platform analytics › Data › Tracking plan, record the events you intend to collect with their required properties, then turn on live verification (last 24 hours). It shows the arrivals per event and how complete the required properties are, which is the schema and completeness check above.
- New event names that you did not plan appear in All-platform analytics › Data › Event inbox until someone claims them, which catches the "release you did not know about" case.
- In All-platform analytics › Operations › Monitors, create a check on a built-in metric such as page views, sessions or error rate, or on a saved custom metric such as the daily count of one event. Pick hourly, daily, weekly or monthly, set the condition, and use the dry run: it computes without sending and tells you how many times the rule would have fired in the past 30 days, which is the backtest.
- Alerts go to email, WeCom, DingTalk, Feishu or a webhook. A monitor only notifies; it does not change anything. The same alert is not repeated for about 60 minutes by default.
FAQ
What should I monitor in a data pipeline?
Start with five checks: freshness (how old the newest data is), volume against the same weekday, required-field completeness, duplicate rate and value ranges. Add error rate and backlog for queue-based pipelines. Each gets a warn and an alert level.
How do I set alert thresholds for data volume?
Compare each day with the median of the same weekday over the last four weeks, and alert below 60% and warn below 80%. Add an upper bound near 150%. Backtest the rule over 28 days before turning it on.
What is data freshness and how do I measure it?
Freshness is the time since the newest record was loaded, measured from an event or load timestamp. A starting rule is to warn at about twice the expected update gap and error at about four times.
How do I reduce false alerts?
Use same-weekday baselines instead of flat thresholds, use medians, backtest every rule, and review each month's alerts as real or false. Retire rules where most alerts are false, and keep a named owner on every alert.
Is run status enough to know a pipeline works?
No. A job can finish successfully and load nothing, half the data or the wrong fields. Pair run status with freshness, volume and schema checks on the data itself.
Sources
- Google SRE Book, Monitoring Distributed Systems (four golden signals; pages should be urgent and actionable). Checked 2026-11-21.
- dbt Docs, freshness (warn_after, error_after; example 12 and 24 hours). Checked 2026-11-21.
- Google Cloud Blog, The right metrics to monitor cloud data pipelines (golden signals mapped to pipeline metrics, data watermark age and system lag). Checked 2026-11-21.
Was this article helpful?
We use your answers to fix and expand this page.
Couldn’t send. Please try again in a minute.
Thanks for the feedback. We’ll use it to improve this page.You’ve already sent feedback on this page. Thanks.

Customer Experience Consultant
Writes about live chat, visitor conversations, and self-service, sharing practical ways to make customer communication clearer and more effective.