Try it on your own data
Every report in this article is in the free plan. One snippet for web and apps, up to 10 sites.
Start freeA data insight is an observation, a cause you checked and an action with a measure, not a number or a trend line. This article gives six examples with the arithmetic shown: a conversion drop that was really a mix shift, a traffic spike made of bots, a checkout step losing 40%, a channel with many visits and few orders, speed versus conversion, and a page that ranks but is not clicked. Each ends with what to do.
What you will learn
- Write every insight as observation, checked cause and action, with the number that will show it worked
- Split by the obvious confounders before believing a blended number: device, channel, human versus bot
- Treat each action as a hypothesis with a check date; only about one in three tested ideas moves its metric
What makes a finding an insight and not just a metric?
A metric says what happened ("conversion was 2.5%"). A finding compares it ("down from 3.2%"). An insight adds the two parts that make a team do something: why it happened, checked against the data, and what to do next, with a number that says whether it worked. If you cannot write the sentence in this shape, it is not an insight yet:
Observation (what, versus what) → Cause (what you checked to rule out the obvious) → Action (the change, the metric, the threshold).
A quick test: delete the first clause and ask whether someone could still act. "Fix the shipping-cost surprise on the cart page and aim to move that step from 60% to 66%" is actionable. "Traffic is up" is not. For the broader definition and how insights differ from raw reports, see data insights; this article stays on concrete examples you can copy and check.
All six examples below use sample data with the arithmetic shown, so you can recompute them.
Example 1: conversion fell, but every segment improved
Observation. Overall conversion fell from 3.17% in October to 2.45% in November. Panic would say "the site got worse".
Cause check. Split the same two months by device:
| Device | Oct visits | Oct orders | Oct rate | Nov visits | Nov orders | Nov rate |
|---|---|---|---|---|---|---|
| Desktop | 20,000 | 800 | 4.0% | 12,000 | 504 | 4.2% |
| Mobile | 10,000 | 150 | 1.5% | 28,000 | 476 | 1.7% |
| Total | 30,000 | 950 | 3.17% | 40,000 | 980 | 2.45% |
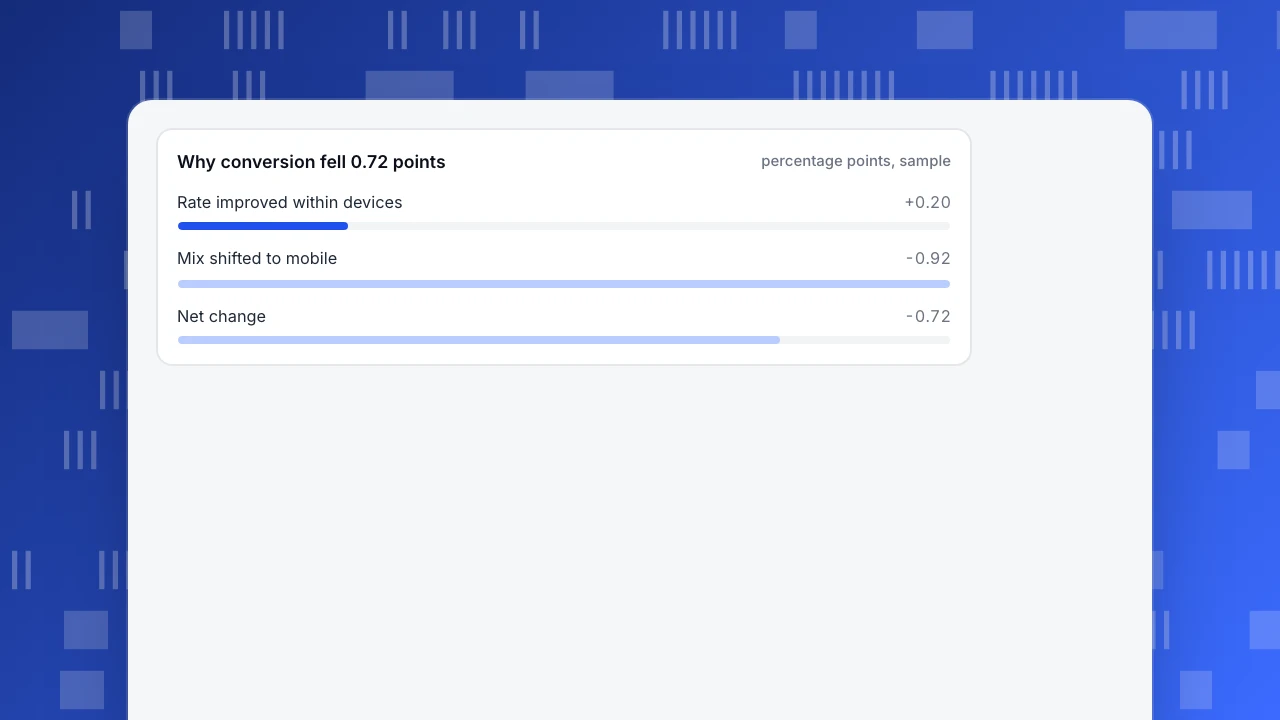
Both devices improved (4.0% to 4.2%, 1.5% to 1.7%), yet the total fell, because mobile, the lower-converting group, grew from a third of visits to 70%. This is Simpson's paradox: a pattern in the whole reverses once you split it into subgroups (Stanford Encyclopedia of Philosophy). Recompute: at October's mix with November's rates, conversion would have been (2/3 × 4.2%) + (1/3 × 1.7%) = 3.37%. So the rate effect was +0.20 points and the mix effect was −0.92 points, which sums to the observed −0.72.
Action. Stop looking at the blended rate. Report conversion by device, and set a mobile target (for example 2.0%) instead of one site-wide number.
Why conversion fell 0.72 points
percentage points, sampleExample 2: a traffic spike that did not buy anything
Observation. Visitors rose 40% week on week, but orders were flat.
Cause check. Sample data: 40,000 human visits with 1,200 orders is 3.0% conversion. If 16,000 more requests came from bots and were counted as visitors, the rate becomes 1,200 ÷ 56,000 = 2.14%, and "conversion fell 29%" appears out of nowhere. Check the bot report before the campaign report: if the extra volume sits in one operator or user-agent family, the spike is not demand.
Action. Report conversion on human visits only, and keep the bot share as its own line so a jump in crawling is visible but not mixed into the denominator.
Example 3: one checkout step loses 40% of the people who reach it
Observation. In a sample funnel of 5,000 carts: 3,000 reach the shipping step (60%), 2,400 reach payment (80% of those), and 1,900 place an order (79.2% of those). Cart to order is 38.0%.
Cause check. The biggest single drop is 40 points, at the step where the shipping cost first becomes visible. This matches outside evidence: in Baymard's review of 50 studies, 40% of US shoppers who abandoned a cart cited extra costs (shipping, tax, fees), the most common reason; 70.22% of carts are abandoned on average (Baymard Institute). Confirm in your own data by checking whether the drop is larger for orders with a high shipping share of the basket.
Action. Show an estimated total on the cart page. Target: move the shipping step from 60% to 66%. Recompute the effect: 5,000 × 66% × 80% × 79.17% = 2,090 orders, 190 more than 1,900, a 10.0% lift in orders from one step.
Example 4: the channel with the most visits is not the one with the most orders
Observation. One channel is a third of all traffic.
| Channel | Visits | Share of visits | Orders | Share of orders | Conversion |
|---|---|---|---|---|---|
| 8,000 | 10.7% | 320 | 18.1% | 4.0% | |
| Search | 30,000 | 40.0% | 900 | 51.0% | 3.0% |
| Social | 25,000 | 33.3% | 125 | 7.1% | 0.5% |
| Direct | 12,000 | 16.0% | 420 | 23.8% | 3.5% |
| Total | 75,000 | 100% | 1,765 | 100% | 2.35% |
Cause check. Social is 33.3% of visits and 7.1% of orders, while email is 10.7% of visits and 18.1% of orders. Before concluding that social is weak, check whether its role is earlier in the journey and shows up as a later direct or search order. A last-touch table cannot say that; a comparison of attribution models can.
Action. Do not cut social on this table alone. Compare first-touch and last-touch for the same period; only if social stays low in both, move the effort to email.
| Channel | Share of visits | Share of orders | Conversion |
|---|---|---|---|
| 10.7% | 18.1% | 4.0% | |
| Search | 40.0% | 51.0% | 3.0% |
| Social | 33.3% | 7.1% | 0.5% |
| Direct | 16.0% | 23.8% | 3.5% |
Sample data: 75,000 visits and 1,765 orders. Social is a third of visits and 7.1% of orders; check assisted conversions before cutting it.
Example 5: fast pages convert better, but is it the speed?
Observation. Sample data: visits where the page's Largest Contentful Paint was 2.5 seconds or less (the "good" threshold in Core Web Vitals) converted at 744 ÷ 24,000 = 3.1%; slower visits converted at 352 ÷ 16,000 = 2.2%.
Cause check. The gap is 0.9 points, but fast and slow pages can also differ in device, country and page type. Outside evidence supports a real effect: in a study of 37 brand sites and over 30 million sessions, a 0.1-second mobile speed improvement was associated with 8.4% higher retail conversions (web.dev, Deloitte study). Still, test it on your own site: compare the same pages before and after a speed fix, with the release marked on the chart.
Action. Fix the 3 slowest high-traffic pages first, annotate the release date, and compare conversion for those pages for 14 days before and after.
Example 6: a page ranks on page one but few people click
Observation. Sample data: a guide ranks at an average position of 6.2 with 18,000 impressions and 270 clicks, a click-through rate of 270 ÷ 18,000 = 1.5%. The other pages ranking in the top 10 on this site have a median click-through of 3.4%.
Cause check. The page is visible but not chosen, so the problem is the title and description, not the ranking. Look at what the query asks versus what the title promises.
Action. Rewrite the title and description to match the query, leave the page alone otherwise, and recheck click-through after 28 days. Search data lags by 1–3 days, so wait for a full window.
How do you write an insight so the team acts on it?
Use one line per insight, in this order, and keep numbers with their comparison:
- Observation: "Mobile conversion is 1.7% versus 4.2% on desktop (November)."
- Cause checked: "Not a bot effect (human visits only); not a mix effect (split by device)."
- Action: "Cut mobile checkout from 5 fields to 3."
- Success measure and date: "Mobile conversion above 2.0% by December 15; recheck weekly."
If a line is missing, say so ("cause not yet checked") rather than guessing; that tells the reader how much to trust the rest.
Which things look like insights but are not?
- A bigger or smaller number with no comparison. "We had 12,400 visits" has nothing to act on.
- A correlation presented as a cause. Example 5 is the classic: speed and conversion move together, so test with before and after.
- A blended average. Example 1 shows how an overall rate can fall while every part rises.
- A result from a tiny sample. If a segment has 12 orders, a change of 3 orders moves its rate by 25%; wait or widen the window.
- An action without a measure. "Improve the checkout" cannot be checked; "move step 2 from 60% to 66%" can.
- Most ideas do not work. At Microsoft, only about one third of ideas tested improved the metric they were built to improve (Kohavi et al., KDD 2013). Treat every action as a hypothesis with a check date.
How do you find these insights in TapCub?
Take Example 1 and Example 2 together: conversion fell, and you need to know whether it is a mix effect or a bot effect. In the console:
- Open Web analytics › Reports and turn on Show change to compare against the previous period or the same period last week. Then ask the AI Assistant (All-platform analytics › Operations › AI Assistant) to break the change down by device and channel; that split is how you find the mix shift in Example 1.
- Open Web analytics › Bots. TapCub counts recognised bots separately, so they do not enter visitor counts or conversion denominators; the AI & agents and All bots tabs show how much crawling there is, so a spike like Example 2 can be explained instead of guessed.
- For the checkout drop in Example 3, build the funnel in All-platform analytics › Behavior › Behavior analysis and compare the step that follows the shipping view.
- For Example 4, compare attribution models side by side in the same place; first-touch, last-touch, linear, position-based and time-decay each get a column, so a channel that only assists stands out.
- For Example 6, connect Search Console or Bing Webmaster and open Monitoring › Search performance: pages ranking in the top 10 with click-through below the median are flagged, and the title and description are the cheapest fix.
- Mark the fix on the charts with Configuration › Annotations, so the before-and-after check in Example 5 is on the page when someone reads it later.
TapCub does not run A/B tests or tell you why something changed; it reports what happened and where, and the cause check is yours. The AI Assistant can break a change down by channel, source, country, device and landing page, which is a useful first cut for the cause check.
FAQ
What is an example of an insight?
"Overall conversion fell from 3.17% to 2.45%, but desktop and mobile each improved; mobile grew from 33% to 70% of visits. Set a separate mobile target rather than chasing the blended rate." It has an observation, a checked cause and an action.
What is the difference between data and an insight?
Data is a recorded value, such as 980 orders. An insight interprets it: it compares against something, explains why, and says what to do next. If nobody can act on it, it is still just data.
How many insights should a report have?
Few. Three to five well-checked insights with an owner and a date each is more useful than twenty observations. Put the cause check in the line so readers know how far to trust it.
How do you know an insight is real and not noise?
Check the sample size, compare against a baseline period, split by the obvious confounders (device, channel, new versus returning), and follow up after the action. About one in three tested ideas moves the metric it was built to move, so plan the follow-up before acting.
Sources
- Baymard Institute: cart abandonment rate statistics, checked 2026-11-21
- web.dev: Milliseconds make millions (Deloitte study), checked 2026-11-21
- web.dev: Web Vitals, checked 2026-11-21
- Stanford Encyclopedia of Philosophy: Simpson's paradox, checked 2026-11-21
- Kohavi et al., Online Controlled Experiments at Large Scale (KDD 2013), checked 2026-11-21
Was this article helpful?
We use your answers to fix and expand this page.
Couldn’t send. Please try again in a minute.
Thanks for the feedback. We’ll use it to improve this page.You’ve already sent feedback on this page. Thanks.

Data Engineer
Writes about event design, data quality, and collection workflows, with verifiable implementation methods for reliable analytics.