Try it on your own data
Every report in this article is in the free plan. One snippet for web and apps, up to 10 sites.
Start freeA data culture is a team habit of using numbers to propose and review decisions, and it is measurable: count metric disputes, decisions that cite a metric, time to answer a data question and weekly active share. Culture, not tools, is the obstacle: 91.9% of executives in one survey named it as the greatest impediment to becoming data-driven.
What you will learn
- Start with three recurring decisions and one written definition per number, not a company-wide mandate
- Change the meeting: same dashboard every week, and a decision log with the number cited
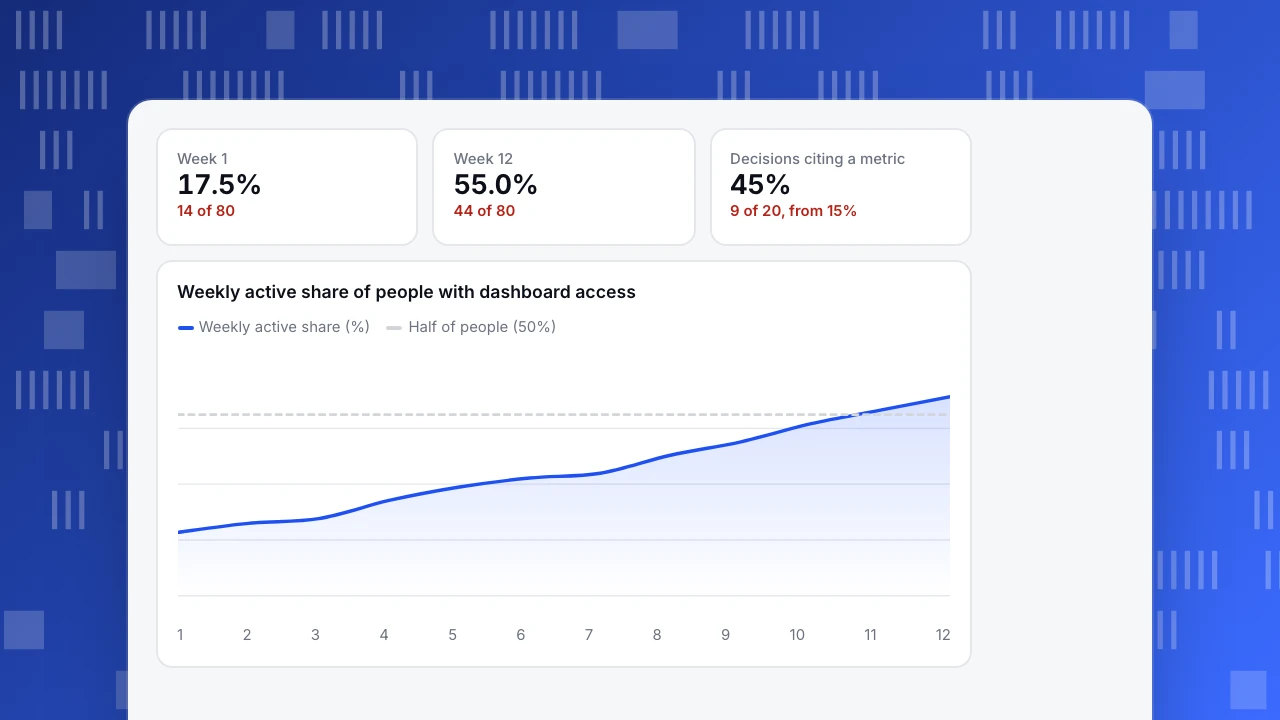
- Track four numbers weekly; in the sample, weekly active share rose from 17.5% to 55.0% in 12 weeks
What a data culture is, and what it is not
A data culture is a team habit: when someone proposes a decision, others ask what the numbers say, and the person can show them without a favour from an analyst. It is not a tool purchase, a dashboard count or a training day. You can see it in behaviour: which numbers appear in a weekly meeting, who can pull them and what happens when two numbers disagree.
That makes it measurable, which most advice about it skips. A culture you cannot measure turns into slogans. This article gives five steps and, for each, a number to watch, so you can tell in a quarter whether it is working. The structure around it, such as who owns data and how access is granted, is covered in data democratization and data maturity model; this article is about the habits.
Why culture, not tooling, is the bottleneck
The best long-running evidence is the executive survey run by NewVantage Partners, now part of Wavestone. In its 2022 edition, 91.9% of executives named cultural challenges as the greatest impediment to becoming data-driven, and only 8.1% named technology limitations. Only 26.5% said they had created a data-driven organization, and only 19.3% said they had established a data culture, as reported by Help Net Security.
The same survey series showed that culture can move. In the 2024 edition, the share of data leaders saying their organizations had established a data and analytics culture rose from 21% to 43%, according to coverage of the Wavestone survey, which attributed the jump mostly to the arrival of generative AI as a reason for people to engage with data.
Two things follow. First, buying another tool does not address what executives say blocks them. Second, culture responds to concrete changes, such as an obvious new reason to use data, rather than to announcements. The next five steps are those changes.
Step 1: pick three recurring decisions, not "all decisions"
Data use spreads from specific decisions, not from a mandate. Choose three decisions your team makes every week or month and already argues about, for example:
- Which campaigns get more budget next month.
- Which support topics get a help article this sprint.
- Whether a release did what it was meant to.
For each, write the one number that would settle it and who needs it. If you cannot name the number, you have found work for the analyst, not a culture problem. Three decisions is a deliberate limit: a team can form three habits per quarter, and a single early win is worth more than a library of dashboards.
Step 2: give each number a single definition
Nothing kills trust faster than two dashboards that disagree. Write a short dictionary of the 10 to 15 numbers that matter: name, formula, source, owner and the date it last changed. "Active user" is the classic case; one team means logged in, another means did a key action.
A dictionary row can be this short: "Active user | people with at least one key action in the last 7 days | event table | owner: head of product | last changed 2026-09-12". Every dashboard that shows the number links to that row, and a change to the row is announced in the team channel, so nobody learns of a new definition from a surprising chart.
Track one measure here: metric disputes per month, the number of times a meeting stops because two people brought different figures for the same thing. In the sample below, it falls from 11 a month to 3 after the dictionary exists. When the number reaches zero, the dictionary is working.
Step 3: put the number in the meeting
Habits form where decisions are made. Change the meeting, not the intranet:
- Open the weekly review with the same one-page dashboard every week, so people learn where to look.
- Add a rule: a proposal for a change comes with a number, or with "I do not know how to measure this yet", which becomes an action.
- Write down decisions in a log with the number cited. This gives you your most honest adoption metric.
Sample data: of the last 20 decisions in the log, 9 cite a metric, or 45%. At the start of the quarter it was 3 of 20, or 15%. A log of 20 is small, so read the trend, not a single month.
| Measure | Week 1 | Week 12 |
|---|---|---|
| Weekly active share (of 80 with access) | 14 = 17.5% | 44 = 55.0% |
| Decisions citing a metric (of 20) | 3 = 15% | 9 = 45% |
| Metric disputes per month | 11 | 3 |
| Median time to answer | 48 hours | 3 hours |
Sample data: a 12-week rollout in a team of 80 people with dashboard access.
Step 4: teach by answering real questions
Data literacy is learned by using data on a question you care about, not by a course. Two practices cost little:
- Open office hours. An analyst holds a fixed 30-minute slot where anyone can bring a question. Keep a tally of questions and which ones were answered from existing dashboards; a rising self-served share is the signal.
- Show the working. When an analyst answers a question, share the query or the chart, not only the result, so people can rerun it next time.
Measure the median time to answer a data question, from the moment it is asked to the moment the asker has the number. In the sample it drops from 2 days to 3 hours as more questions are answered from a saved dashboard.
Decide who changes first
A data culture starts with the people whose behaviour others copy. Assign three roles, each with one visible action:
- The sponsor (a head of a function) asks "what number is that?" in every review for a quarter, and brings their own number to their own proposals. If the sponsor decides on instinct, the log in step 3 will show it.
- Metric owners (one named person per number in the dictionary) answer questions about their metric within a day and approve any change to its definition.
- The analyst runs the office hours and turns repeated questions into saved dashboards, so the same question is never answered twice by hand.
Review the roles after 12 weeks with the same scorecard. If decisions citing a metric have not moved from 15%, the cause is almost always the first role, not the tooling.
Step 5: measure adoption weekly, with three or four numbers
Keep the scorecard small and keep it visible.
| Measure | How to calculate | Sample at week 1 | Sample at week 12 |
|---|---|---|---|
| Weekly active share | People who opened a dashboard in the week ÷ people with access | 14 ÷ 80 = 17.5% | 44 ÷ 80 = 55.0% |
| Decisions citing a metric | Logged decisions with a number cited ÷ logged decisions | 3 ÷ 20 = 15% | 9 ÷ 20 = 45% |
| Metric disputes per month | Meetings stopped by conflicting numbers | 11 | 3 |
| Median time to answer | Hours from question to number | 48 hours | 3 hours |
The weekly series for the first measure, from 14 active people in week 1 to 44 in week 12 of 80 with access, is 17.5%, 20.0%, 21.3%, 26.3%, 30.0%, 32.5%, 33.8%, 38.8%, 42.5%, 47.5%, 51.3% and 55.0%.
Set a target you can lose, such as "half of everyone with access opens a dashboard weekly by the end of the quarter", and review it at the same meeting as the metrics themselves.
Week 1
17.5%
14 of 80
Week 12
55.0%
44 of 80
Decisions citing a metric
45%
9 of 20, from 15%
Weekly active share of people with dashboard access
Weekly active share (%)Half of people (50%)What not to measure
- Dashboards built. More dashboards usually means more disagreement.
- Logins. Opening a tool is not using a number; pair it with decisions cited.
- Training hours attended. It measures attendance, not use.
- A single survey score on "data-driven". People rate themselves flatteringly. Use behaviour, such as the log.
When a measure becomes a target people can game it: someone who is judged on weekly opens will open the dashboard without reading it. That is why the log of decisions, which is harder to fake, is in the scorecard.
Support the habit in TapCub
Take the first three steps and see what TapCub provides.
- Define each number once. Save a metric in All-platform analytics › Behavior › Metrics & SQL (a formula, or an event plus an aggregation), and build saved analyses on it, so a change to the definition changes every board that uses it.
- Make one page the default. In All-platform analytics › Overview › My dashboards, build the weekly review board from saved analyses and set it as the default.
- Bring the number to people who will not log in. Turn on a read-only share link (with an optional password) from the saved analysis or dashboard, or subscribe people to a daily, weekly or monthly report; an admin turns sharing on. Shared pages show at most the last 90 days.
- Let people ask. All-platform analytics › Operations › AI Assistant answers a plain-language question with a chart; its numbers come from queries on your own project. It does not set up monitors or send notifications for you.
The adoption numbers in the table, such as who opened which internal board, are yours to count: TapCub's documentation does not describe a report of internal dashboard viewers, so track that in a sheet or in your internal tool. TapCub supplies the shared definitions, and the numbers they produce.
FAQ
What is data culture?
Data culture is a team habit in which people use numbers to propose, challenge and review decisions, and can get those numbers without waiting for an analyst. It is visible in behaviour: which numbers appear in meetings, and what happens when two numbers disagree.
How do you build a data culture?
Pick three recurring decisions, give every metric one written definition, open the weekly meeting with the same dashboard, answer real questions in open office hours and track a few adoption numbers every week. Start small and show a win before you widen it.
Why do data culture initiatives fail?
Usually because they start with tools or training instead of decisions. In the NewVantage survey, 91.9% of executives named culture, not technology, as the greatest obstacle. A second cause is distrust: two dashboards that disagree teach people to ignore both.
How do you measure data culture?
Use behaviour measures: weekly active share of people with access, the share of logged decisions that cite a metric, metric disputes per month and median time to answer a data question. In the sample, these moved from 17.5%, 15%, 11 and 48 hours to 55.0%, 45%, 3 and 3 hours.
How long does it take to build a data culture?
Expect a quarter to see the first measures move, and a year or more for habits to hold. In the Wavestone survey series, the share of organizations reporting an established data culture stayed between about 20% and 30% for years before rising to 43% in 2024.
Sources
- Help Net Security, How companies manage data and AI initiatives (NewVantage Partners 2022 Data and AI Leadership Executive Survey: 91.9% culture vs 8.1% technology; 26.5% data-driven organization; 19.3% data culture). Checked 2026-11-21.
- BigDATAwire, Wavestone survey shows GenAI is having a major impact on data culture (2024: established data and analytics culture rose from 21% to 43%). Checked 2026-11-21 from the search listing; the page itself blocks automated fetches.
Was this article helpful?
We use your answers to fix and expand this page.
Couldn’t send. Please try again in a minute.
Thanks for the feedback. We’ll use it to improve this page.You’ve already sent feedback on this page. Thanks.

Customer Experience Consultant
Writes about live chat, visitor conversations, and self-service, sharing practical ways to make customer communication clearer and more effective.