Try it on your own data
Every report in this article is in the free plan. One snippet for web and apps, up to 10 sites.
Start freeA pain point in business is a specific problem a customer hits that costs them time, money or effort, and you find it by tagging what they already told you. In the sample, pricing was the most common topic in 200 chats (26.0%), but integrations ranked first once severity was counted (38 × 3 = 114 against 52 × 2 = 104).
What you will learn
- About 60 random conversations surface a problem hitting 1 in 20 customers (95.2%); use about 200 to rank
- Score = conversations × severity; frequency alone can rank the wrong problem first
- Confirm each top pain point with a behaviour signal before you fix it
What a pain point in business is
A pain point is a specific problem a customer runs into that costs them time, money or effort, and that they would pay or switch to avoid. "Customers want better service" is a wish; "customers cannot find out whether the product connects to their accounting tool" is a pain point, because you can see it, count it and fix it. In business the usual groups are financial (price is unclear or too high), productivity (it takes too long), process (a step is confusing or missing) and support (they cannot get an answer). The groups are only a way to organise what you find; the data does the work.
The cheapest source of pain points is not a survey. It is the questions customers already typed to you, and what they did on the page before and after. This article shows a method with sample data: collect 200 chat conversations, tag them, rank by frequency and severity, then check each top pain point against behaviour data. How chat works as a customer-service channel is in live chat customer service, and the replay tool used for confirmation is defined on the session replay page.
Where pain points show up in your own data
| Source | What it tells you | Weakness |
|---|---|---|
| Chat transcripts | The exact words customers use, on the page where the problem hit | Only people who chose to ask |
| Offline messages and emails | Problems from people who could not reach anyone | Slower, fewer |
| Session replays and heatmaps | What people did before leaving: repeated clicks, long pauses, back-and-forth | Shows behaviour, not the reason |
| Knowledge-base searches that find nothing | Questions your content does not answer | Needs a log of failed searches |
| Funnel drop-offs | Where people stop, with counts | Says where, not why |
Use at least two sources for any pain point you decide to act on: words from one (what people say) and behaviour from another (what they do).
Step 1: collect enough conversations
How many transcripts do you need? If a pain point affects 5% of customers and you read n conversations picked at random, the chance of seeing it at least once is 1 − 0.95ⁿ. For n = 59 that is 1 − 0.95⁵⁹ = 95.2%. So about 60 conversations will surface almost any problem that hits one customer in twenty, and 200 gives you enough volume to rank them. Nielsen Norman Group's classic model for usability testing uses the same idea: if each test user reveals 31% of the problems, five users find 1 − 0.69⁵ = 84.4% of them, which is why a handful of interviews is enough to find the common ones, but not to measure how common they are.
Rules: sample across the whole period rather than one busy day, include conversations that ended without a resolution, and do not read only the angry ones. Angry conversations are loud, but a mild question such as "is there a way to export this?" can describe the same pain point and is easy to overlook, so tag by the problem, not by the tone. Also keep the conversation date, because a pain point that clusters in the week after a release points at the release.
Step 2: tag each conversation with one main pain point
Read each conversation and write one tag for the main problem, in the customer's words first and your category second. Keep a list of at most 10 tags; if a new tag shows up three times, add it; if two tags always appear together, merge them. Record the page the chat started on beside each tag.
Sample data: 200 conversations from one month on a B2B software site:
| Pain point | Conversations | Share of 200 |
|---|---|---|
| Pricing is unclear | 52 | 26.0% |
| Cannot find an integration | 38 | 19.0% |
| Setup is confusing | 34 | 17.0% |
| Login or password problems | 30 | 15.0% |
| Cannot export data | 22 | 11.0% |
| Billing or invoice questions | 14 | 7.0% |
| Other | 10 | 5.0% |
The sum is 200. The top share of 26.0% has a rough 95% margin of ±6.1 points (1.96 × √(0.26 × 0.74 ÷ 200)), so pricing and integration (19.0%) are not clearly different from each other, and ranking by frequency alone is not safe.
| Pain point | Conversations | Severity | Score |
|---|---|---|---|
| Cannot find an integration | 38 | 3 | 114 |
| Pricing is unclear | 52 | 2 | 104 |
| Setup is confusing | 34 | 3 | 102 |
| Cannot export data | 22 | 2 | 44 |
| Billing or invoice questions | 14 | 3 | 42 |
| Login or password problems | 30 | 1 | 30 |
| Other | 10 | 1 | 10 |
Sample data: 200 conversations in one month; severity is a judgement from 1 to 3.
Step 3: rank by frequency and severity
Frequency says how many people hit it. Severity says what it costs: 1 for an annoyance, 2 when it blocks a task for a while, 3 when it stops someone buying or makes them leave. Score = conversations × severity. The severity ratings are your judgement; write down why you chose each one.
| Pain point | Conversations | Severity (1–3) | Score |
|---|---|---|---|
| Cannot find an integration | 38 | 3 | 114 |
| Pricing is unclear | 52 | 2 | 104 |
| Setup is confusing | 34 | 3 | 102 |
| Cannot export data | 22 | 2 | 44 |
| Billing or invoice questions | 14 | 3 | 42 |
| Login or password problems | 30 | 1 | 30 |
| Other | 10 | 1 | 10 |
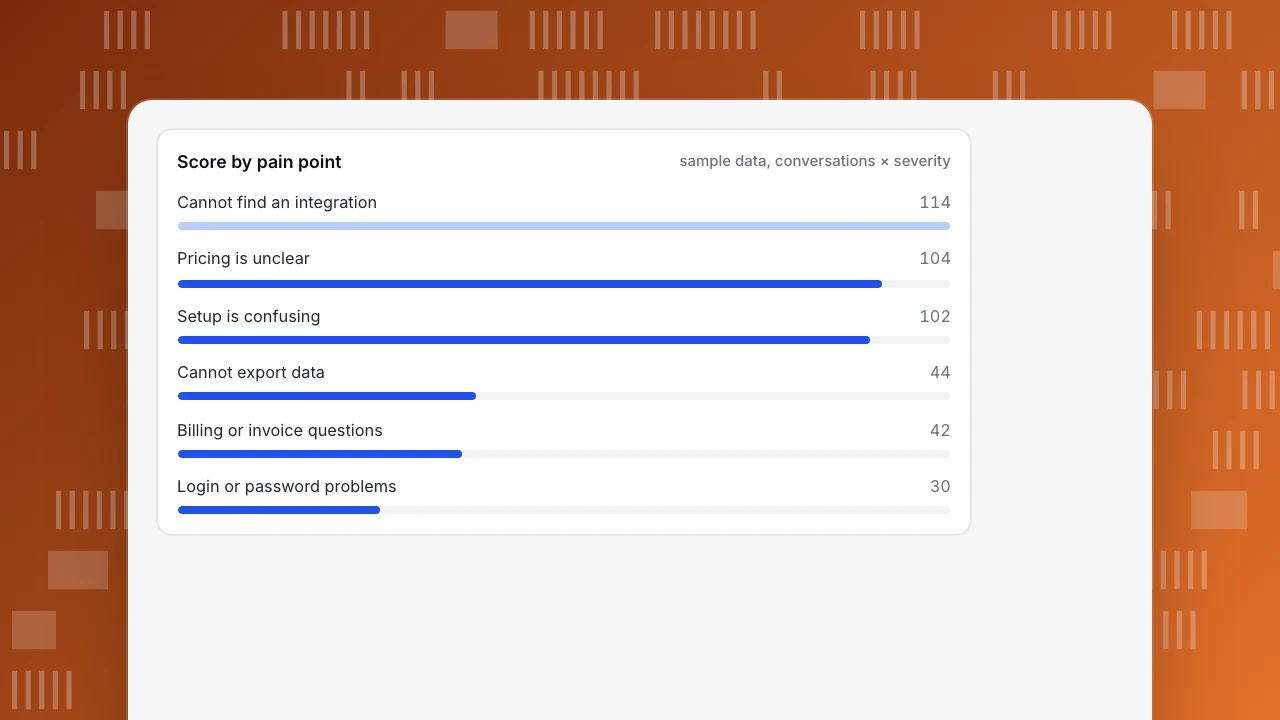
Total score 446. Pricing is the most frequent, but integrations rank first once severity is counted: 38 × 3 = 114 against 52 × 2 = 104. The top three account for (114 + 104 + 102) ÷ 446 = 71.7% of the total score, so they are the shortlist.
Score by pain point
sample data, conversations × severityStep 4: check each top pain point against behaviour
A pain point heard in chat is a hypothesis. Match each with a signal that does not depend on what people said:
| Pain point | Behaviour signal | Where to look |
|---|---|---|
| Integration not found | Visits to the integrations page ending in exit; searches for a tool name | Exit rate on that page; chats that start there |
| Pricing unclear | Repeated clicks on plan names, long time then exit, back-and-forth between pricing and features | Replays and click heatmap of the pricing page |
| Setup confusing | Drop between signup and first activation | Funnel from signup to activation; median time between steps |
If chat says "pricing is unclear" and the heatmap shows people clicking a plan name that is not a link, you have a fix. If chat says it and nothing in behaviour agrees, you may have a loud minority, and a second round of reading is cheaper than a redesign.
Write each pain point as a sentence the team can act on
A tag like "integrations" is too vague to brief a designer. Turn each shortlisted pain point into one sentence with a situation, a blocked task and a reason: When [situation], customers cannot [task] because [reason]. Examples from the sample:
- When evaluating the product, customers cannot tell whether it connects to their accounting tool, because the integrations page lists only categories, not tool names.
- When comparing plans, customers cannot tell what happens when they go over the seat limit, because the pricing page does not say.
- When setting up, customers cannot finish importing contacts, because the file format is not described until after the upload fails.
Each sentence points to a page and a fix, and each can be checked: after the fix, does the question disappear from chat? Add three more rules: quote one real customer line under each sentence so nobody argues about interpretation, record the number of conversations behind it, and drop any sentence you cannot tie to a page or a step. A list of five such sentences, with counts and quotes, is a better brief for a product meeting than a deck of general themes.
Step 5: turn a pain point into a fix and a number
For each shortlisted pain point write: the change ("add a list of 30 integrations with logos to the integrations page"), the metric that should move ("share of chats about integrations falls from 19% to under 10%; signup rate from the integrations page rises"), and a review date. Re-tag a new sample of 200 conversations a month after the fix. If the pain point's share does not fall, the fix missed the cause, and you go back to step 4.
How to do it in TapCub
Run the five steps with TapCub for the sample above:
- Read the conversations. Open Live chat › Inbox; each conversation shows the page it started on, the visitor's source and the last two days of browsing, and you can open the analytics profile with one click. TapCub does not tag topics automatically, so keep your tags in a spreadsheet beside the conversation list.
- Find the pages where chats start. Live chat › Reports › Conversion attribution lists the pages conversations start on, so you can see that the pricing page produces the most chats.
- Check offline messages and the knowledge base. Live chat › Chat settings › Offline messages holds questions left when nobody was online, and Live chat › Knowledge base reports show how many questions were answered directly; a low hit rate on a topic marks a content gap.
- Confirm with behaviour. Open All-platform analytics › Behavior › Heatmaps for click and rage-click patterns on the pricing page, and Session replay to watch single sessions. Session replay is off by default, so turn it on first. For the setup pain point, build the signup-to-activation funnel in Behavior analysis.
- Measure the fix. Compare the funnel and the share of chats from the fixed page a month later.
TapCub shows what people asked and did; deciding severity and writing the fix is your job.
FAQ
What are pain points in business?
They are specific problems customers hit that cost them time, money or effort, such as unclear pricing or a missing integration. A pain point is worth acting on when you can count it and tie it to behaviour.
How do you find customer pain points?
Read chat transcripts, offline messages and failed searches, tag each with one main problem, count them, rank by frequency × severity, and confirm the top ones with replays, heatmaps and funnels.
How many conversations do I need to read?
About 60 random conversations show almost any problem that affects one customer in twenty (95.2%). Use about 200 to rank the problems.
What are examples of customer pain points?
Pricing that is hard to understand, a missing integration, a confusing setup, login problems, data that cannot be exported, and billing questions. The sample ranked integrations first once severity was counted.
What is the difference between a pain point and a feature request?
A pain point is the problem the customer has; a feature request is their suggested solution. Record the problem, since the right fix is often not what they asked for.
Sources
- Jakob Nielsen, Why You Only Need to Test with 5 Users, Nielsen Norman Group, 18 March 2000 (31% discovery rate; 1 − (1 − L)ⁿ).
- Baymard Institute, Cart Abandonment Rate Statistics (reasons shoppers give for abandoning checkout, as an example of a coded list of pain points).
- TapCub documentation, Live chat reports and Session replay (docs.tapcub.com), checked 2026-11-21.
Was this article helpful?
We use your answers to fix and expand this page.
Couldn’t send. Please try again in a minute.
Thanks for the feedback. We’ll use it to improve this page.You’ve already sent feedback on this page. Thanks.

Technical Engineer
Focuses on tracking code, SDKs, and API integrations, with practical guidance on implementation checks and troubleshooting.