Try it on your own data
Every report in this article is in the free plan. One snippet for web and apps, up to 10 sites.
Start freeCustomer journey visualization means drawing the routes people actually take, from event data. Use a path chart or Sankey to discover routes, a funnel to measure a process you already know, and a timeline to explain one person's sequence. In the sample below, a funnel written in advance reports 15.0% signup and misses 90 signups on routes nobody wrote down; the path view finds them.
What you will learn
- Match the chart to the question: paths and Sankey explore, funnels measure, timelines explain
- Every journey chart trims to the top nodes; raise the node count once and look at what was folded away
- Promote the route that matters into a fixed funnel with a window, then re-run the exploration monthly
What does a customer journey visualization actually show?
A customer journey visualization is a chart built from recorded events that shows the routes people take between two points, such as first landing and signup, and where they leave along the way. It is different from a customer journey map, the workshop artefact with stages, feelings and touchpoints that people draw by hand (see customer journey map). A map records what you believe happens. A visualization shows what the event log says happened, one route and one drop-off at a time.
That difference decides how you build it. A hand-drawn map starts from stages you chose in advance. A data-built visualization can start from nothing: pick a starting page or event, and let the data show the most common next steps. Then you check the stages you assumed against the stages people actually used. The rest of this article covers which chart fits which question, how to prepare the data, a complete worked example you can recompute, and how to read a Sankey without being fooled by the trimming that every tool applies.
Which chart fits which question?
There is no single best chart. Each one answers a different question, and picking the wrong one is the most common reason a journey chart looks impressive and decides nothing.
| Question | Chart | What it shows | Weak spot |
|---|---|---|---|
| What do people do after landing here? | Path tree or step-by-step path chart | The most common next pages or events from a start, step by step | Long tail is hidden; no fixed order of stages |
| How much volume moves along each route? | Sankey | Flow width proportional to sessions or people between steps | Gets unreadable beyond about 5 steps or 15 nodes per step |
| Of the people who start a known process, how many finish? | Funnel | Ordered steps with count, rate and drop-off | Only shows the steps you wrote down in advance |
| What did one person do, in order? | Timeline | One person or session's events with timestamps | Does not generalise; use for debugging and examples |
| How do stages compare week to week? | Staged journey map with reach and drop-off | A fixed list of stages, same map each week | Needs the stages to be defined first |
Use the path chart or Sankey to explore, the funnel to measure a process you already understand, and the timeline to explain a surprising number by reading real sessions. A good analysis usually uses them in that order: explore with paths, promote the route that matters into a funnel, then open a few timelines of people who dropped to see why.
| Question | Chart | Weak spot |
|---|---|---|
| What do people do after landing here? | Path tree | Long tail hidden |
| How much volume moves along each route? | Sankey | Unreadable beyond ~5 steps |
| How many finish a known process? | Funnel | Shows only steps you wrote |
| What did one person do? | Timeline | Does not generalise |
| How do stages compare weekly? | Staged journey map | Stages must be defined first |
Use them in order: explore, fix the route that matters as a funnel, then read timelines of people who dropped.
How should you prepare the event data first?
A journey chart can only be as clean as the events under it. Five checks before you draw anything:
- Name the nodes consistently.
checkout_starton web andbegin_checkoutin the app are two nodes to the chart. Decide one name per action, or choose to chart pages on the web and screens in the app separately. - Decide what counts as a step. Page views alone miss everything that happens inside a page. Add the few events that matter, such as a signup button click or a form submit, and leave out noise such as scroll or hover events.
- Pick the counting unit. Sessions answer "how did this visit go". People answer "how did this person get there over several visits". Sessions are the safer default for a first look; people matter when the journey spans days.
- Filter out non-human traffic. Crawlers and monitoring bots follow neat paths and enter at odd pages. Left in, they inflate the first step and create flows nobody walked.
- Fix the window. Decide how long between the first and last step still counts as one journey: one session, 7 days, 30 days. Write it on the chart.
One definitional point helps with step 2. In Google Analytics 4 a session counts as engaged if it lasts longer than 10 seconds, includes a key event, or has two or more page or screen views (Google Analytics Help, checked 2026-11-21). If the chart is meant to describe real attempts rather than accidental landings, filtering to engaged sessions first removes the one-page, few-second visits that otherwise make every route look like it ends at step one.
What does a worked example look like?
Sample data: 1,000 sessions that landed on the homepage of a software site. We chart three steps: step 1 is the landing page, step 2 is the page viewed next, step 3 is what happened after that. Counts are sessions.
| From step 2 | Sessions | To signup | To pricing | To docs | Left the site |
|---|---|---|---|---|---|
| Pricing | 420 | 150 | n/a | 60 | 210 |
| Blog | 380 | 40 | 120 | n/a | 220 |
| Docs | 200 | 50 | 30 | n/a | 120 |
| Total | 1,000 | 240 | 150 | 60 | 550 |
Check the arithmetic: each row adds up to its step-2 total (150 + 60 + 210 = 420; 40 + 120 + 220 = 380; 50 + 30 + 120 = 200), and the three step-2 groups add to 1,000. The overall step-3 signup rate is 240 ÷ 1,000 = 24.0%.
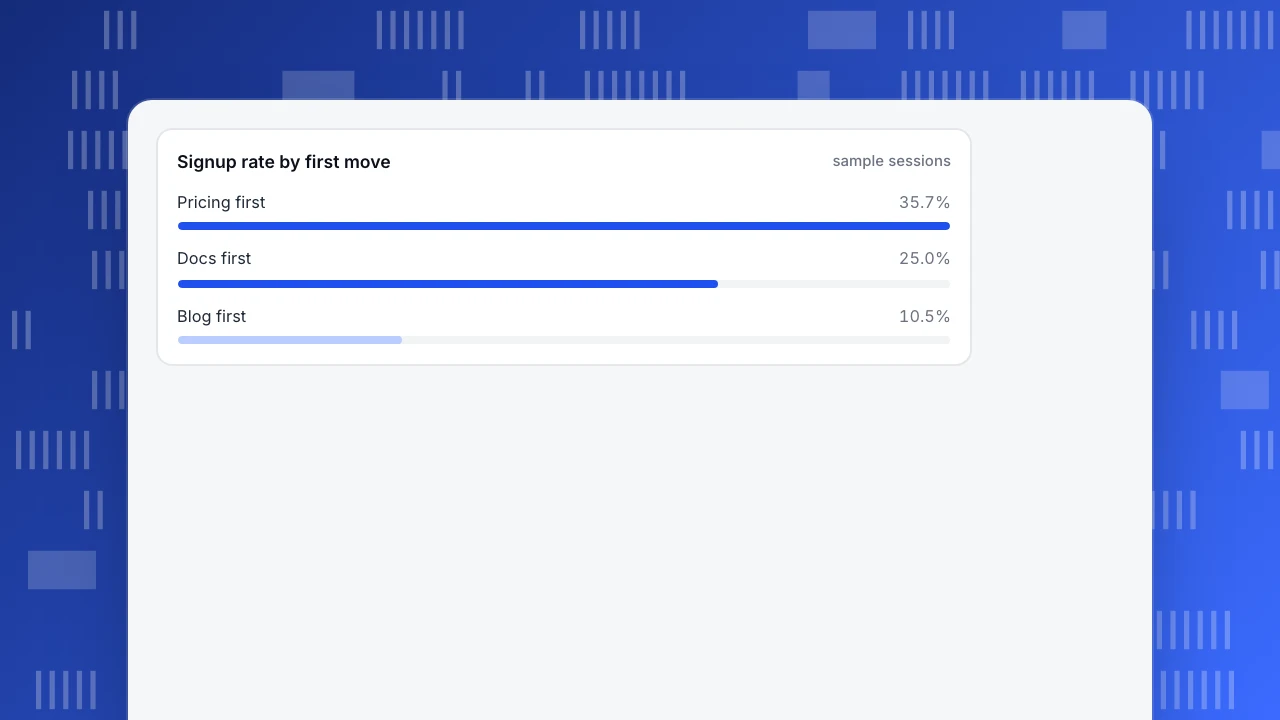
Now compute the rate for each first move: pricing 150 ÷ 420 = 35.7%, docs 50 ÷ 200 = 25.0%, blog 40 ÷ 380 = 10.5%. A funnel written as "landing, pricing, signup" would report only the first route and a 15.0% overall rate (150 ÷ 1,000). It would hide that 90 more signups (40 from blog, 50 from docs) arrive by routes you did not write down, and that 120 blog readers (31.6% of 380) go on to pricing, a page where 35.7% of first-click visitors go on to sign up. That route is worth strengthening, and it is exactly what a path view finds and a pre-written funnel cannot.
The Sankey of these numbers has three columns and twelve ribbons, counting the ones that leave. The widest ribbon runs from landing to pricing, then a thick one from pricing to signup. Two things the picture makes obvious: more than half of sessions (550 of 1,000) are gone by step 3, and the blog column is wide but thin on the way to signup.
Signup rate by first move
sample sessionsHow do you read a Sankey without being fooled?
Every journey chart hides something so that it stays readable. Know what, before you trust it.
- Trimming. Tools keep only the most frequent nodes per step and fold the rest into "other". Google Analytics path exploration shows the top 5 nodes per step by default, up to 20 with "+ More", and groups the rest into Others (Google Analytics Help, checked 2026-11-21). A rare but valuable route, say 15 sessions that convert at 60%, disappears into Others. Raise the node count once and look at what is folded away.
- Counting unit. The same chart in sessions and in people can disagree. A person who visits three times appears once as a person and up to three times as sessions.
- Direction. Forward paths (from a start) answer "where do they go". Backward paths (to an end such as signup) answer "how did they get here". Backward charts are better for finding routes to a conversion; forward charts are better for finding leaks after a page.
- Drop-off is only clean forward. In a backward view the width of a flow is a count of people who arrived at the end, not a rate of those who left.
- Loops. Refreshes and back-button use repeat the same node. Collapse repeated identical nodes, or the chart shows a page flowing into itself.
- Small flows are noisy. A ribbon of 12 sessions that converts "at 50%" is six people. Do not rank routes below about 30 sessions against each other.
How do you turn the picture into a funnel?
Once the path view shows the routes that matter, fix them as a funnel so you can track them weekly. A funnel needs three decisions the path chart did not force on you: the ordered steps, the window and the counting rule.
For the example above, write the steps as "viewed pricing" then "signup", with a 7-day window. Now people who read the blog first and came back through pricing the next day count, which a same-session rule would have missed. Then add a second funnel for the docs route. Compare the two on conversion rate and on median time between steps; if the docs route converts at 25.0% but takes three days, it is a slower, not a worse, route.
Keep the exploration alive too. Rerun the path view monthly from the same start point and compare the top nodes to your funnel steps. When a node you never wrote down climbs into the top three, it has become part of the journey, and the funnel needs a new step or a sibling.
How do you build this in TapCub?
Take the example above and run it on your own project.
- Open All-platform analytics › Behavior › Behavior analysis and choose paths. Pick the node type (page or screen, event, or both) and a start anchor, such as your landing page. Direction is forward by default; switch to backward and set signup as the end to see routes into it.
- Set steps and nodes. Steps run from 2 to 10 (default 5) and each step keeps 3 to 15 nodes (default 8), folding the rest into "other". Repeated identical nodes collapse by default. Counting defaults to sessions; switch to people if the journey spans visits.
- Read the flow and the forward drop-off, which is inflow minus what continued. Export gives source, target and count, so you can recompute the table above yourself.
- Promote the route that matters into a funnel in the same area. Steps run from 2 to 20, the conversion window defaults to 7 days and can go up to 180, and each step shows its rate against step one, against the previous step, and the median time from the previous step.
- For a fixed map you compare weekly, build stages in All-platform analytics › Business › Journey maps. A journey holds up to 20 stages, reach is counted in sessions, and each stage shows error, frustration and exit shares.
Two limits to state plainly. Paths keep at most 50,000 transitions before trimming, so a very long tail is dropped first. And bots and AI crawlers are counted separately, so they do not walk fake routes through your chart. TapCub draws the chart and counts; it does not decide which route deserves investment. That reading is yours.
What mistakes make journey charts misleading?
- Charting everything. Fifteen steps and forty nodes is a poster. Start with 3 to 5 steps and 8 nodes.
- Treating the busiest path as the best path. In the example the pricing route converts at 35.7% but carries 420 sessions; the blog route carries 380 and converts at 10.5%. Volume and rate are different questions.
- Mixing devices without saying so. Mobile and desktop journeys differ. Split the chart by device before concluding anything about a route.
- Reading causation into order. A page that appears before signup is not necessarily why people signed up. It may just be on the way.
- Forgetting the window. A three-day journey drawn as a single-session chart looks like heavy drop-off that is really people returning later.
FAQ
What is customer journey visualization?
It is a chart built from event data that shows the routes people take from a starting point to an outcome and where they drop off. Typical forms are path trees, Sankey diagrams, funnels and timelines. It differs from a hand-drawn journey map, which records assumed stages and feelings rather than measured routes.
Which chart is best for visualizing the customer journey?
It depends on the question. Use a path chart or Sankey to discover routes, a funnel to measure a known ordered process, and a timeline to read one person's sequence. Most analyses use them in that order, exploring first and then fixing the important route as a funnel.
What is the difference between a Sankey diagram and a funnel?
A funnel shows an ordered list of steps you defined in advance, with the count and drop-off at each. A Sankey shows every route between steps, including ones you did not define, with ribbon width proportional to volume. The funnel measures a process; the Sankey discovers which processes exist.
How many steps should a journey chart have?
Three to five steps and about eight nodes per step is a good start. Beyond that the chart becomes hard to read and tools trim the long tail anyway. Google Analytics shows 5 nodes per step by default, up to 20; TapCub keeps 3 to 15 nodes per step.
Can I build a journey visualization without a data team?
Yes, if the events are named consistently and tracking is in place. Path and funnel views in an analytics tool need no SQL. The preparation work, naming events, deciding the counting unit and the window, matters more than the tool.
Sources
- Google Analytics Help: Path exploration, checked 2026-11-21
- Google Analytics Help: Engagement rate and engaged sessions, checked 2026-11-21
Was this article helpful?
We use your answers to fix and expand this page.
Couldn’t send. Please try again in a minute.
Thanks for the feedback. We’ll use it to improve this page.You’ve already sent feedback on this page. Thanks.

Data Engineer
Writes about event design, data quality, and collection workflows, with verifiable implementation methods for reliable analytics.