Try it on your own data
Every report in this article is in the free plan. One snippet for web and apps, up to 10 sites.
Start freeA customer engagement score is a weighted sum of what a person does: weight each valuable event, cap how many count, add them up and scale to 0–100. The score is only worth using if higher bands retain better, so this guide builds the score, works through four sample people and then tests the bands against 90-day retention, where it climbs from 5% to 90%.
What you will learn
- Weight events by closeness to the outcome and cap each one so a noisy event cannot dominate
- Add recency decay so a heavy user who went quiet drops in score
- Validate against retention on a fresh period; a score that does not separate outcomes is decoration
What is a customer engagement score, and what does it add?
A customer engagement score turns what a person does into one number, so you can rank people, spot the ones fading and trigger a different action for each band. The usual model is a weighted sum: pick the events that show a customer getting value, give each a weight, multiply by how many times it happened in a window, and add them up.
The score is useful only if it is predictive: higher scores should go with better outcomes such as renewal, repeat purchase or upgrade. That is the part most guides skip. They explain how to add up weights and stop. This article builds the score, then tests it against an outcome, because a score that does not separate retained from lost customers is only decoration. For a set of engagement metrics (rates, frequency, depth) rather than a per-person score, see customer engagement metrics; for the product-usage version used in SaaS, see product engagement score.
What is the formula?
Four parts, each easy to recompute:
Points for one event type = weight × min(count, cap)
Raw score = sum of points over all event types in the window
Recency (optional) = multiply each event's points by 0.5^(age in days ÷ half-life)
Scaled score = min(100, raw score ÷ reference × 100)
- The cap stops one noisy event from drowning the rest. Without it, a person with 40 page views outscores a person who bought once.
- The half-life says how fast engagement fades. With a half-life of 14 days, an event from 7 days ago counts 0.5^0.5 = 71% and one from 28 days ago counts 0.5^2 = 25%.
- The reference is the point total of a "highly engaged" person, for example the top-decile user in your own data. It fixes the 0–100 scale.
Google's own definition of an engaged session shows the same logic in a simpler form: a session counts as engaged if it lasts longer than 10 seconds, has a key event, or has at least two page or screen views (Google Analytics Help). A score generalises that yes-or-no rule into weighted points.
How do you choose events and weights?
Start from actions that show value delivered, then weight by how close the action is to the outcome you care about. A starting table for an online store (all weights are assumptions you should replace with your own):
| Event | Weight | Cap per window | Why this weight |
|---|---|---|---|
| purchase | 10 | 5 | The outcome itself |
| checkout_start | 5 | 5 | Strong intent, not yet value |
| add_to_cart | 3 | 5 | Intent |
| chat_started | 2 | 5 | Asked a question, which signals interest |
| search | 1 | 5 | Looking, low commitment |
| page_view | 0.2 | 5 | Cheap and frequent, so near zero |
Rules that keep the table honest:
- Weight by closeness to the outcome, not by how easy it is to count. Page views are plentiful, so they get the lowest weight.
- Use a cap equal to the count after which more of the same event stops telling you anything new.
- Include negative signals if you have them (a refund, a support complaint) with negative weights.
- Do not exceed about 10 event types. Beyond that, nobody can explain the score.
If you have outcome data, you can estimate weights instead of guessing them: fit a logistic regression with counts as inputs and "retained or not" as the outcome, and scale the coefficients (scikit-learn: logistic regression). Round them to whole numbers so the table stays readable.
| Event | Weight | Cap per window |
|---|---|---|
| purchase | 10 | 5 |
| checkout_start | 5 | 5 |
| add_to_cart | 3 | 5 |
| chat_started | 2 | 5 |
| search | 1 | 5 |
| page_view | 0.2 | 5 |
Sample weights for an online store; replace them with your own after checking against retention.
Worked example: scoring four people
Sample data for one 28-day window. With the table above, the points are weight × min(count, 5):
| Person | Events | Raw (no cap) | Capped points | Scaled (÷ 40 × 100, max 100) |
|---|---|---|---|---|
| A | 2 purchases, 5 add_to_cart, 6 searches, 30 page views | 47.0 | 41.0 | 100 |
| B | 2 add_to_cart, 3 searches, 18 page views, 1 chat | 14.6 | 12.0 | 30 |
| C | 40 page views, 2 searches | 10.0 | 3.0 | 7.5 |
| D | 1 purchase, 1 checkout_start, 1 add_to_cart, 9 page views | 19.8 | 19.0 | 47.5 |
Recompute person A: purchase 10 × 2 = 20; add_to_cart 3 × 5 = 15; search 1 × 5 (capped from 6) = 5; page_view 0.2 × 5 (capped from 30) = 1; total 41. Raw without caps would be 20 + 15 + 6 + 6 = 47. Person C is the reason for the cap: 40 page views and 2 searches make 10 raw points, two-thirds of B's 14.6, from browsing alone; capped, C is 3 points.
The reference of 40 points is an assumption here (a top-decile person in this sample); A scores 41 ÷ 40 × 100 = 102.5, shown as 100 after the cap. Add recency and A's score changes: if both purchases were 28 days ago, they count 25% each, so the 20 purchase points become 5 and A falls to 26 capped points (65 scaled). This is the point of recency: a heavy buyer who went quiet should drop.
How do you check the score predicts anything?
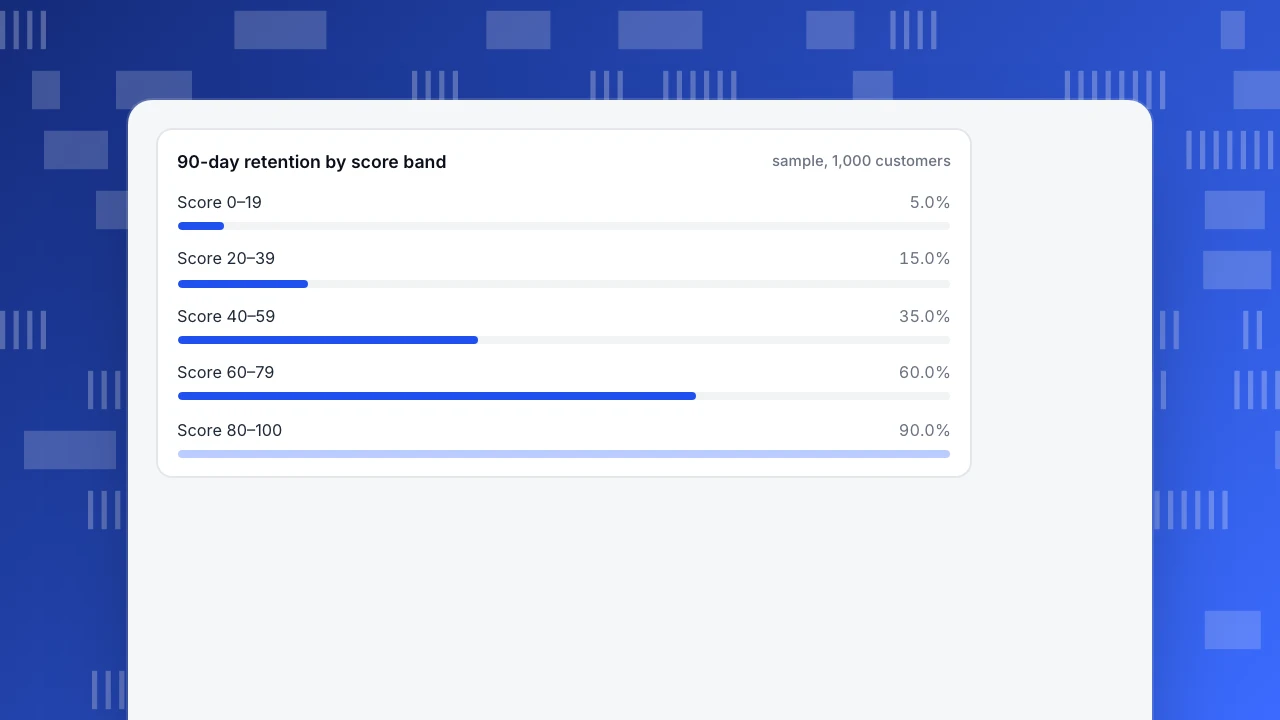
Take everyone who had a score at the start of a period and compare against what happened in the next 90 days. Sample data, 1,000 customers:
| Score band | Customers | Retained | Retention rate |
|---|---|---|---|
| 0–19 | 400 | 20 | 5.0% |
| 20–39 | 300 | 45 | 15.0% |
| 40–59 | 180 | 63 | 35.0% |
| 60–79 | 90 | 54 | 60.0% |
| 80–100 | 30 | 27 | 90.0% |
| All | 1,000 | 209 | 20.9% |
Retention rises at every step (5% to 90%), which is what a useful score looks like. Two checks matter more than the shape:
- Monotonic. If the 40–59 band retained worse than 20–39, a weight is wrong. Look for an event that is high-frequency and weakly related to the outcome and lower its weight or cap.
- Not just volume. Compare against a simple baseline such as "number of sessions". If the score does not separate outcomes better than that, it is not adding information.
Do this on a period the weights were not fitted on, otherwise the table flatters you.
90-day retention by score band
sample, 1,000 customersWhat do you do with the bands?
A score earns its keep only when each band triggers a different action. From the table above:
- 0–19 (40% of customers, 5% retained). Low cost only: an automated re-onboarding message. Do not spend human time here.
- 20–39 (30%, 15%). The persuadable middle: point them to the one action that moves them to the next band, for example adding a first item to the cart.
- 40–59 (18%, 35%). Nudge towards purchase; offer help at the step where they stall.
- 60–100 (12%, 60% to 90%). Protect: do not interrupt with discounts they do not need; invite to reviews or referrals.
- A falling band. Watch the change, not the level. A person moving from 60–79 to 20–39 in one window is the earliest signal you have.
Which mistakes make a score misleading?
- No cap. One high-volume event dominates, and the score becomes "number of page views" in disguise.
- Weights from gut feeling and no check. The score may feel right and still not predict.
- One score for every segment. A new customer and a long-term one differ; compare within a lifecycle stage.
- Mixing people and bots. Automated traffic inflates counts and wrecks the top band; score human visitors only.
- Anonymous visitors. A visitor with no profile cannot hold a score over time; score identified users and treat the rest as a funnel problem.
- Making the score the goal. If a team is paid on the score, events get gamed. Report the outcome (retention) next to the score.
How do you build this in TapCub?
TapCub does not calculate an engagement score for you, and it does not trigger emails or discounts. What it does give you is the event data and the grouping tools to build the score above and test it:
- Collect the events. Make sure purchase, add-to-cart, checkout start, search and chat events are being sent, and identify logged-in users so the activity belongs to a person; identified people appear in All-platform analytics › Users › People with a day-by-day timeline.
- Compute the score. In All-platform analytics › Behavior › Behavior analysis open the SQL tab and query the events view per person: weight each event type, cap each count at 5 with a
CASEexpression, and sum. The same view carries asubjectcolumn for the chosen identity. Save common building blocks, such as purchases per person, as metrics in Metrics & SQL. - Make the bands. Create rule segments in All-platform analytics › Users › Segments & tags for "did add_to_cart at least once in 28 days" and similar conditions, or paste IDs from the SQL result into a static segment. Segment sizes keep a 30-day trend, so you see bands filling or draining.
- Check the outcome. Use Behavior analysis retention for each band as a cohort, and compare with the retention table above.
- Add the human check. Open a few low-band profiles and, for those who chatted, read the conversation: in Live chat › Inbox the visitor's recent browsing is next to the messages.
FAQ
How do you calculate a customer engagement score?
Pick the events that show value, give each a weight, multiply by the number of times it happened in a window (capped), and add them. Scale the total to 0–100 and, if you want fading engagement to count, discount older events with a half-life.
What is a good customer engagement score?
There is no universal number; the score is relative to your own scale. What matters is whether bands separate outcomes. In the sample above, 80–100 retained at 90% and 0–19 at 5%, so a "good" score is whatever band your data shows retains.
How do you weight engagement events?
Weight by closeness to the outcome (purchase above search above page view). If you have outcome data, fit a logistic regression and use the rounded coefficients; if not, start with simple assumptions and validate against retention.
How often should the score update?
Daily is enough for most products. Use a window that matches your buying cycle: 28 days for frequent purchases, 90 days for rare ones. Recompute and recheck the bands against outcomes each quarter.
What is the difference between an engagement score and engagement metrics?
Metrics describe a population (engagement rate, sessions per user). A score ranks each person so you can treat them differently. Use metrics to see the trend and a score to decide who gets which action.
Sources
- Google Analytics Help: engagement rate and engaged sessions, checked 2026-11-21
- scikit-learn: logistic regression, checked 2026-11-21
Was this article helpful?
We use your answers to fix and expand this page.
Couldn’t send. Please try again in a minute.
Thanks for the feedback. We’ll use it to improve this page.You’ve already sent feedback on this page. Thanks.

Data Engineer
Writes about event design, data quality, and collection workflows, with verifiable implementation methods for reliable analytics.